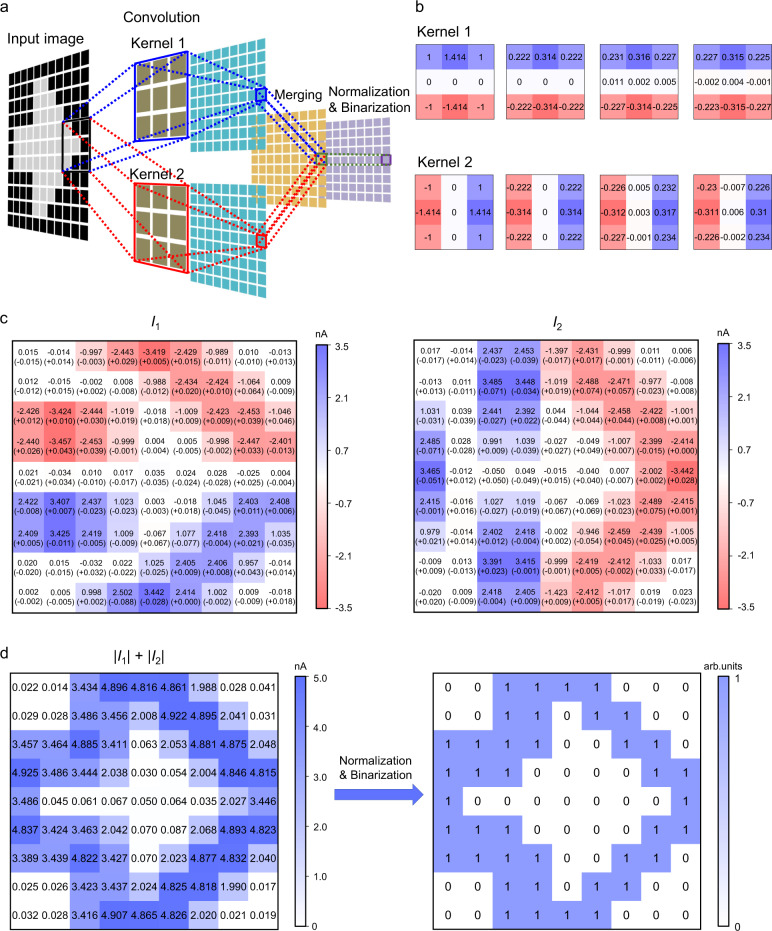
Fig. 6. Implementation of edge detection.
a Schematic illustration of the operations for the edge detection. The convolution is implemented by sequentially presenting the sub-images whose pixel values are translated to the illumination signals to the kernels based on FE-PS-NET. The merging, normalization, and binarization of output currents are performed in software. b From left to right: theoretical dimensionless weights, theoretical photoresonsivities scaled from dimensionless weights, actual weights right after programming, and actual photoresonsivities after edge detection, for Kernel 1 and 2. The unit of photoresponsivity is mA/W (not shown). c Output currents I1 (left panel) and I2 (right panel) after the convolution with the two kernels. The values outside the brackets are the actual I1 and I2 values while those in the brackets are the differences between the theoretical I1 and I2 values and their corresponding actual values. d Image obtained by merging I1 and I2 (left panel) and final output image after normalization and binarization showing the detected edge (right panel).

