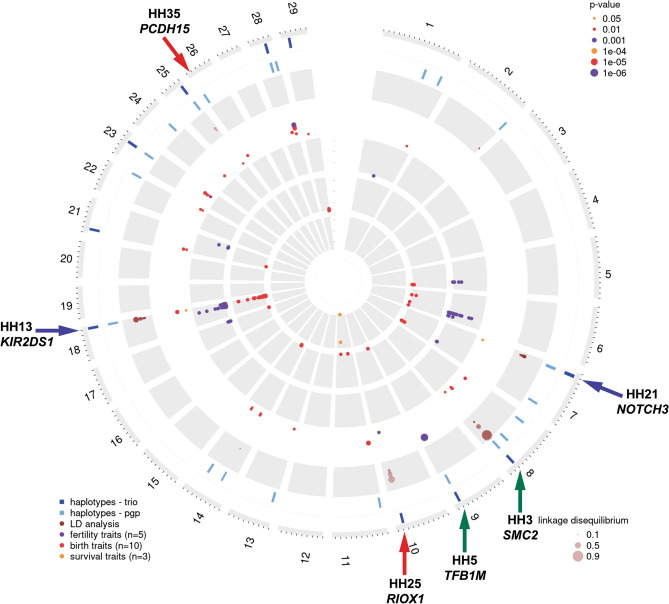
Figure 1.
Summary of the SNP and WGS data analyses of the Swiss Holstein population. This plot visualises all the comprehensive genomic analysis. The most outer circles show the haplotypes per chromosome with reduced homozygosity for the trio approach in dark blue and the pgp approach in light blue. LD (r2) between haplotypes and markers of the custom SNP array is indicated in the circle with the brown dots. Note the dot size correlates with the LD extent. The fourth circle shows significant results from the haplotype to phenotype association analyses. Note that the three evaluated trait groups are represented by different colours and the dot size correlates with the significance values. The three inner circles present the significant (p < 0.0000043) GWAS results across the fertility (purple), birth (red) and survival (yellow) traits. Scales are based on the − log10(p-value). Note the green arrows indicating previously identified haplotypes and candidate causal variants. The blue arrows indicate the previously identified haplotypes HH21 and HH1313,16,18 and the herein described candidate causative variants in the genes NOTCH3 and KIR2DS1, respectively. Finally, the red arrows indicating the newly identified haplotypes HH25 and HH35 harbouring most likely causative variants in the genes RIOX1 and PCDH15.

