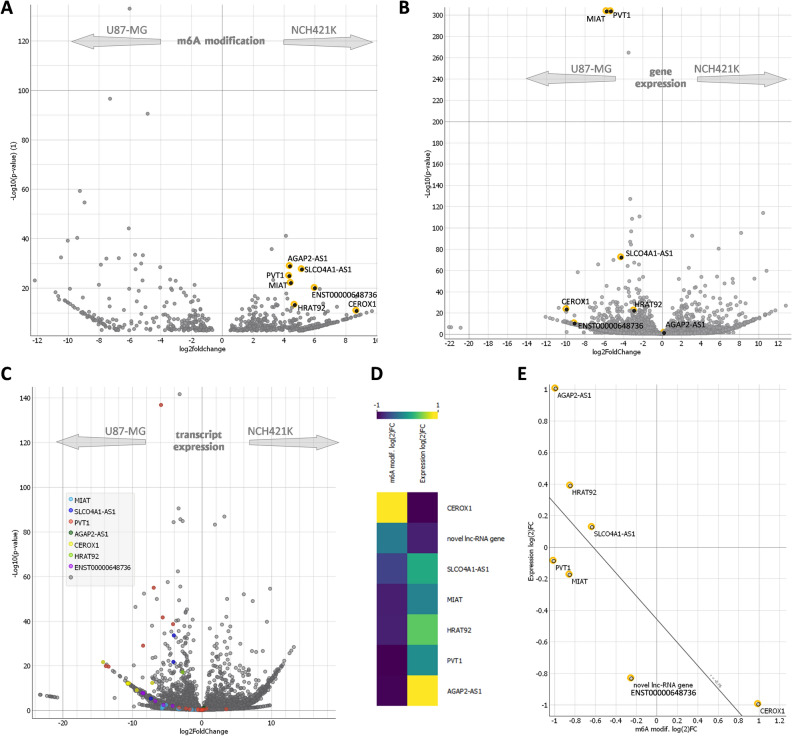
Figure 2.
Visualization of screened-out lncRNAs (A) Volcano-plot of seven selected highly in NCH421K cells modified lncRNAs (black dots with yellow edging) in the context of all detected lncRNAs (FDR q < 0.01). (B) Volcano-plot of gene expression. Screened out lncRNAs indicated in black dots with yellow edging. (C) Volcano-plot transcripts expression. (D) The heat-map of gene expression (Log2FC) and m6A modification (Log2FC) of screened out lncRNAs. (E) The correlation scatterplot of screened out lncRNAs expression and m6A modification.

