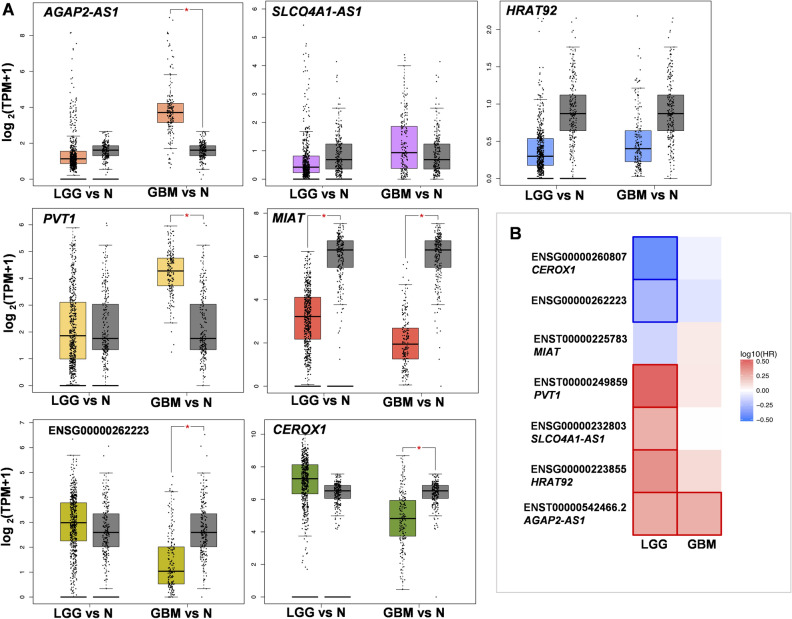
Figure 3.
lncRNAs analysis on Gepia platform. (A) lncRNAs gene expression (log2(TPM + 1)) in low grade glioma (LGG, n = 518), glioblastoma (GBM, n = 163) and normal tissue (N, n = 207) for AGAP2-AS1, SLCO4A1-AS1, HRAT92, PVT1, MIAT, ENSG00000262223 and CEROX1. Significant difference shown as asterisk: * = log2FC = 1, p-adj. < 0.01. (B) Prognostic impact of lncRNAs expression level based on the survival heat map in LGG and GBM. Heat map shows hazard ratios (HR) in log10 for different genes. The red and blue blocks denote higher and lower risks, respectively. The rectangles with frames mean the significant (FDR p-adj. > 0.01) unfavorable and favorable results in prognostic analyses.

