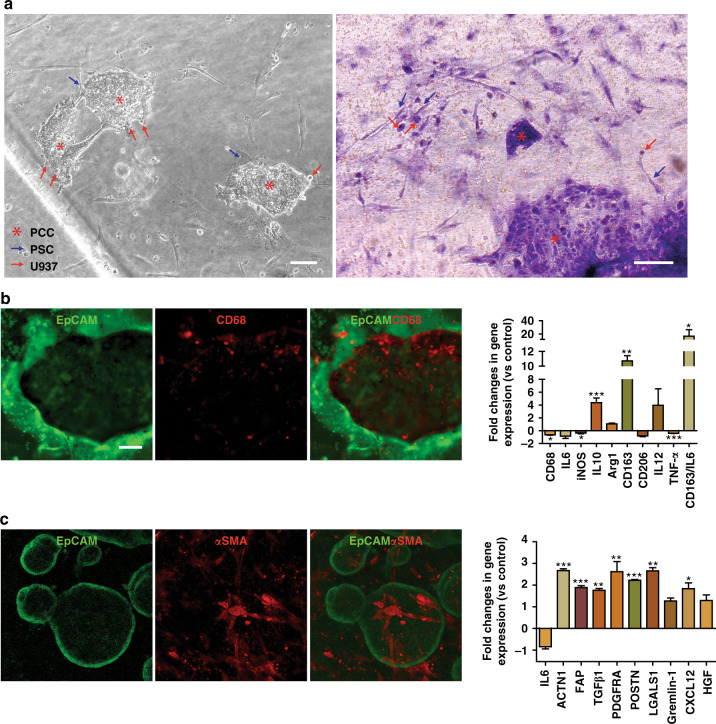
Fig. 5. Recapitulation of the PDAC TME in chips.
a Phase-contrast and H&E staining assessment of the cell-laden chips after 6 days of coculture with continuous medium perfusion. b, c Immunostaining of PCCs for EpCAM, U937 cells for CD68, and PSCs for α-SMA. The expression profile of human U937 monocytes and PSCs in the organoids was performed by qPCR analysis. The fold change in gene expression was normalized to the housekeeping gene GAPDH and compared to the cells in monoculture. Data were expressed as the mean ± SEM, n = 3 per experiment. Scale bar, 100 µm. *p < 0.05, **p < 0.01, ***p < 0.001

