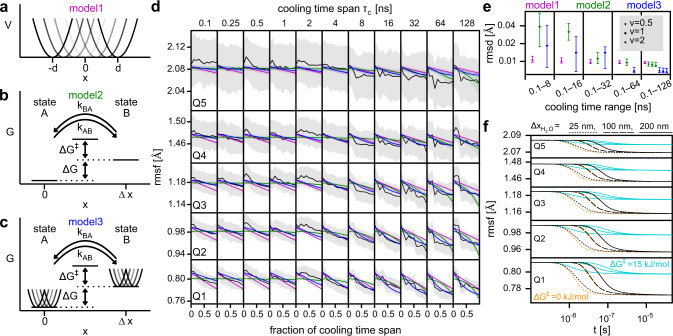
Fig. 3. Models of cooling behavior.
Schematics of thermodynamic model1 with uniformly distributed harmonic potentials (a), kinetic two-state model2 (b), and combined model3 (c). d Comparison of the time dependence of the rmsf quantiles obtained from T-quench simulations after rescaling (black lines, compare Fig. 2c) with those obtained from the models (magenta, green, and blue lines). Standard deviations from simulations and the models are shown as gray and colored areas, respectively. e For each model, the root mean square deviation (rmsd) of the predicted rmsf values from the rmsf values obtained from the T-quench simulations (d, black lines) is shown. Rmsf values were obtained from 41 simulations for each cooling time span. To obtain model parameters, the T-quench rmsf values for different ranges of cooling time spans were used (0.1–8 ns, 0.1–16 ns, … ). The symbols denote the mean values and the vertical lines correspond to the 95% confidence intervals obtained from the parameter distributions. f Rmsf decrease during plunge freezing as a function of time for the quantiles estimated from combining model3 with temperature drops (Fig. 1c) for different water-layer thicknesses ().

