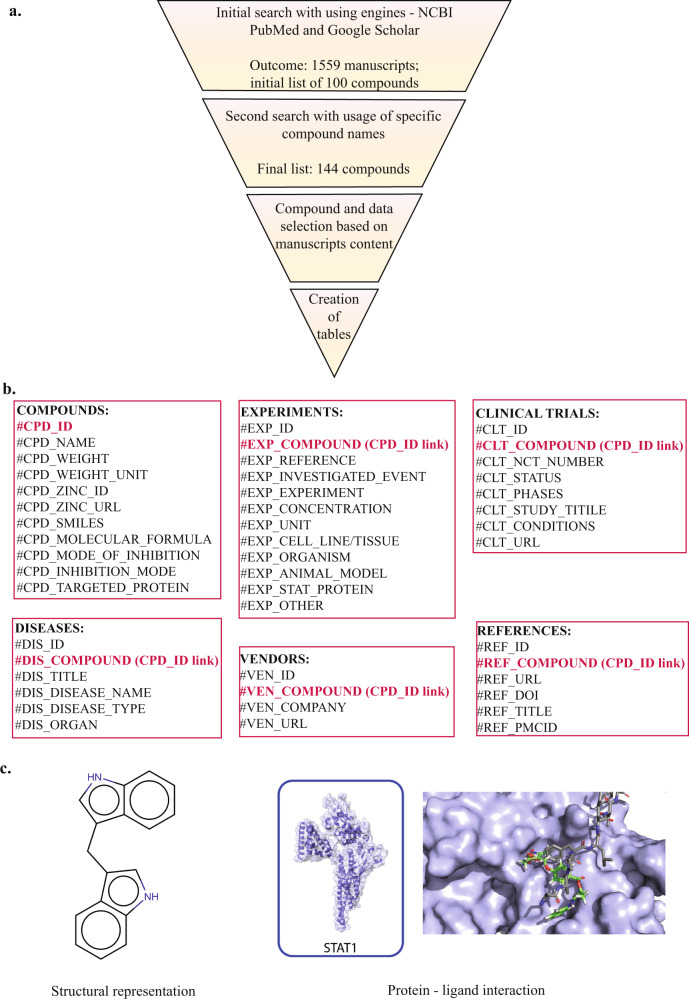
Fig. 1.
Methodology of data collection and categorization. (a) Presentation of workflow for data collection. Gathered data was examined and categorized allowing to establish final list of 141 inhibitory compounds. (b) Outline of tables used for creation of SINBAD. Gathered data was put into 6 tables which are linked with each other (marked with red) by one variable - specific number each compound was given in initially created table COMPOUNDS. (c) Graphical data available in SINBAD. We provide structures of compounds and for some we visualized ligand – protein interaction using STAT-SH2 3D models and Surflex -Dock 2.6.

