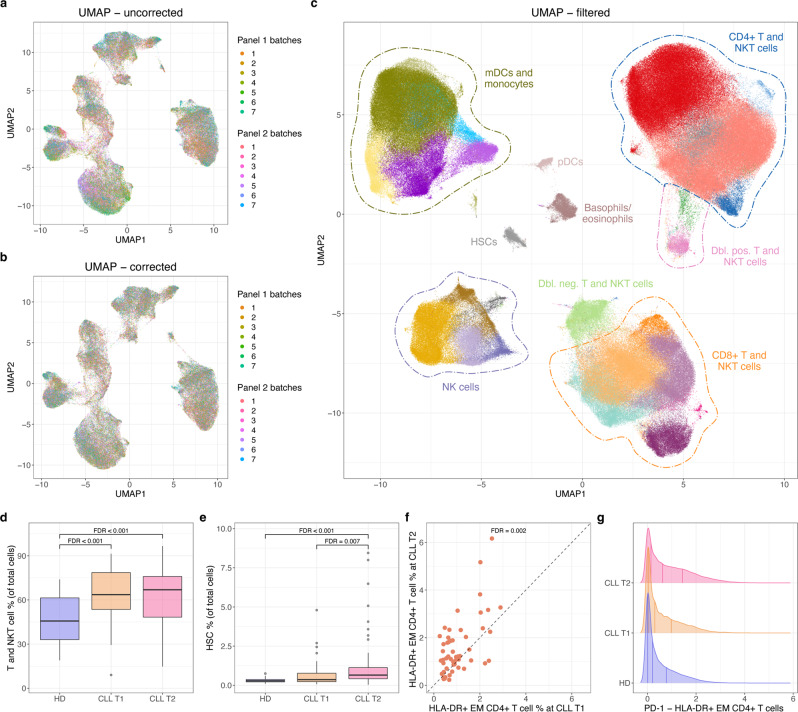
Fig. 2. Integration and analysis of 128 CyTOF samples from seven different batches and two different panels.
a UMAP-based on expression of the 12 overlapping lineage markers included in the final clustering for both panels 1 and 2 before any batch correction. Using ~100,000 cells with equal sampling from all batches. b Same as in a, but after batch correction both within and between batches. c UMAP for up to 4000 cells from each of the 128 samples based on expression of the 23 clustering markers after removal of B, chronic lymphocytic leukemia (CLL), and poor-quality cells. Generated after panel merging, clustering, and filtering, detailed labels in Supplementary Fig. 4. d, e Box plots comparing the cell type proportion of two overall cell types between three sample groups: Healthy donor (HD) (n = 20), CLL time point 1 (T1) (n = 52), and CLL time point 2 (T2) (n = 56). The box plots show the medians (solid line in boxes), 25th and 75th percentiles as lower and upper hinges of the boxes, and whiskers extend to the furthest data point within 1.5* interquartile range from the hinges. Data points beyond this threshold are shown as circles. False discovery rates (FDRs) for the differential abundance testing are added to the comparisons yielding significant (FDR < 0.01) results. Please note the use of different y axes. f Scatter plot for the proportion of HLA-DR + effector memory (EM) CD4+ T cells in paired CLL T1 and T2 samples. FDR value from differential abundance testing within the T and NKT cell compartment. g Density plots for PD-1 expression levels in the HLA-DR + EM CD4+ T cell population (panel 1 cells only) for the three sample groups: HD, CLL T1, and CLL T2.

