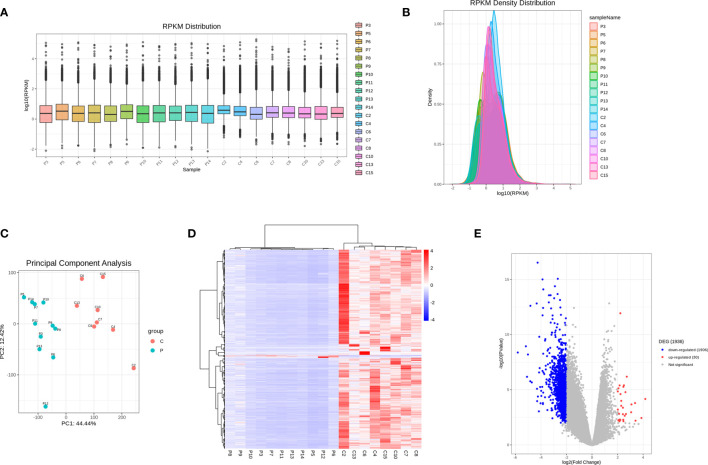
Figure 1.
RNA-seq analysis of differentially expressed genes between PCOS and control group. (A) Boxplots of abundance of transcripts in each sample. (B) RPKM density distribution in each sample. (C) PCA of averaged, rank-normalized read counts from RNA-seq. (D) Heatmap analysis of differentially expressed genes between control group and PCOS group. (E) Volcano plots showing the significance and log2 fold-change (logFC) for all gene transcripts reliably detected in the RNA-seq analysis between control group and PCOS group.

