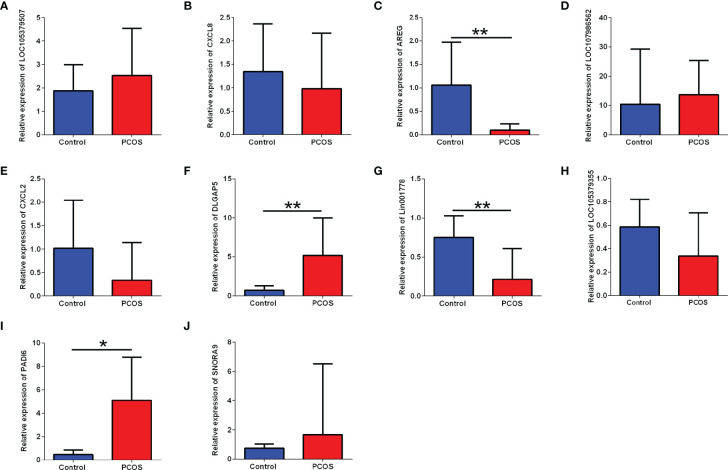
Figure 4.
Validation analysis of selected differentially expressed candidate genes between control group and PCOS group. The mRNA expression levels of (A) LOC105379507, (B) CXCL8, (C) AREG, (D) LOC107986562, (E) CXCL2, (F) DLGAP5, (G) Lin001778, (H) LOC105379355, (I) PADI6, and (J) SNRA9 in the ovarian tissues between control group and PCOS group. N = 8–11. *P < 0.05 and **P < 0.01.

