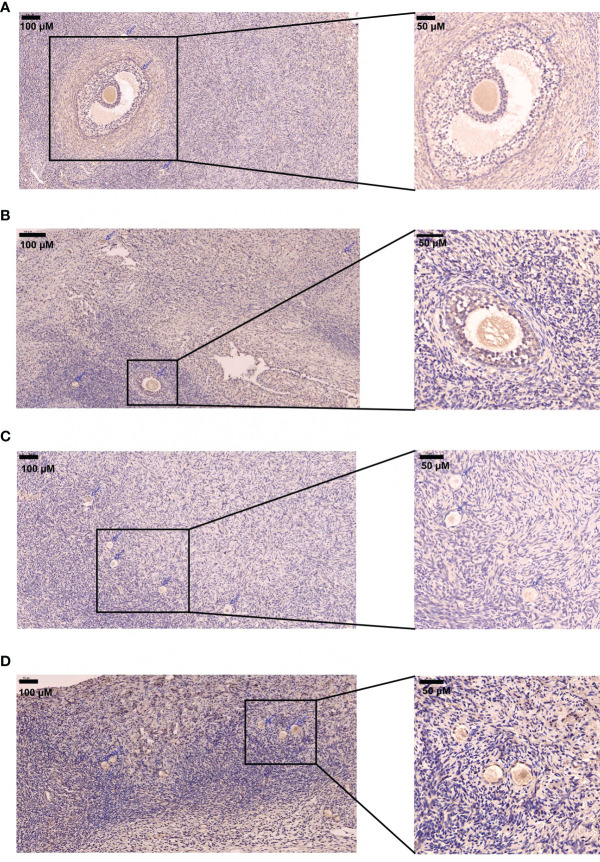
Figure 5.
Immunostaining analysis of DLGAP5 in the ovarian tissues. (A) Immunostaining of DLGAP5 in control group. Scale bar = 200 µm. (B) Immunostaining of DLGAP5 in PCOS group. Scale bar = 200 µm. (C) Immunostaining of DLGAP5 in control group. Scale bar = 200 µm. (D) Immunostaining of DLGAP5 in PCOS group. Scale bar = 200 µm. Blue arrows indicate primary or antral follicles.

