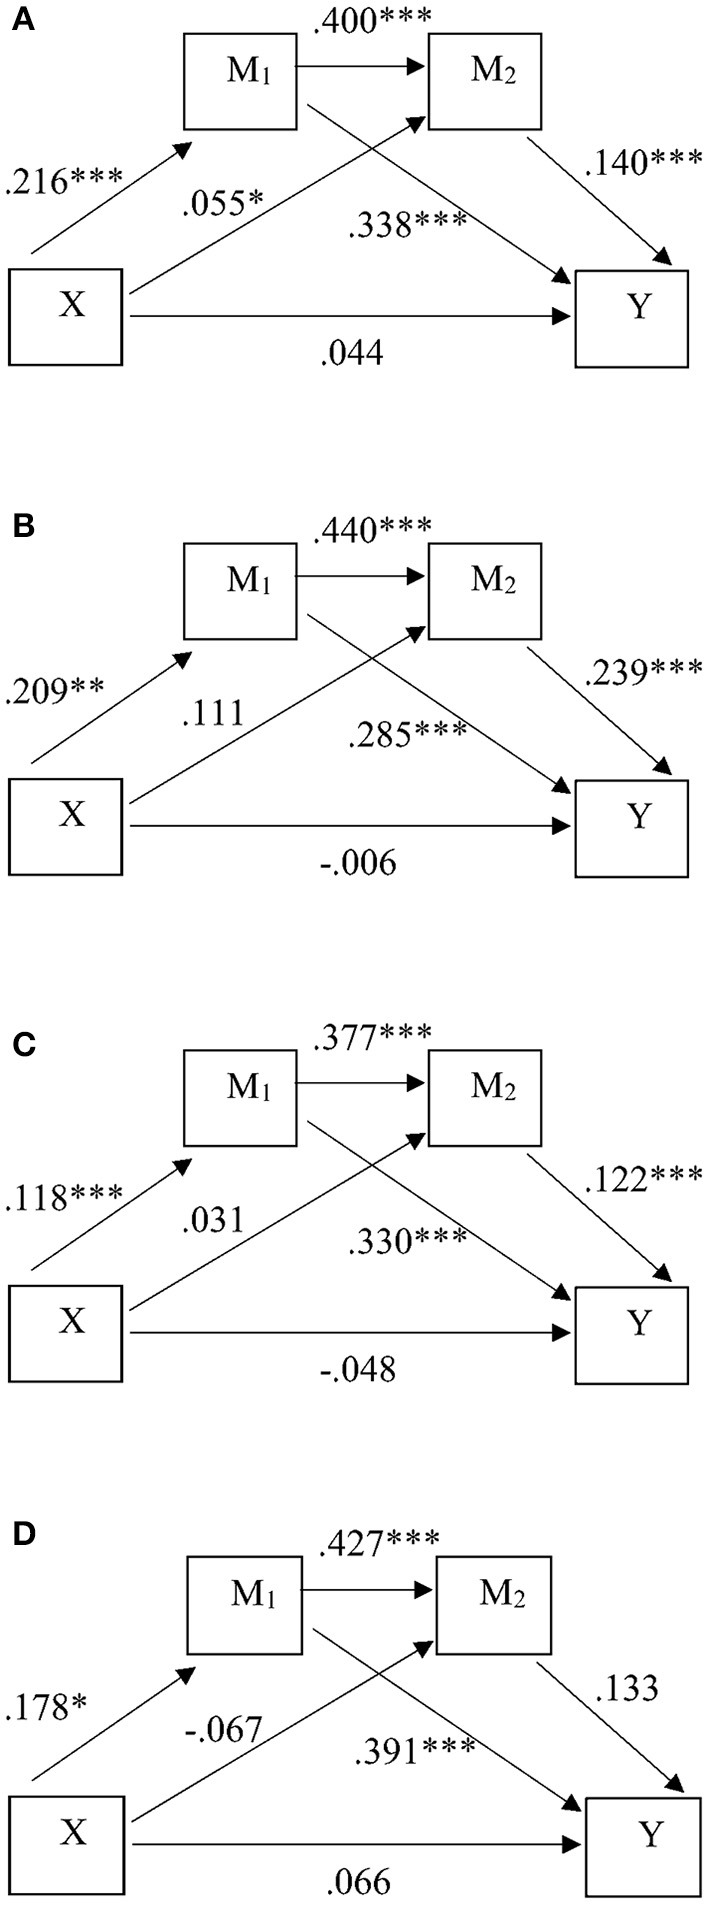
Figure 2.

Predictive model standardized effects for the HE student groups: (A) all students (N = 1,332), (B) students with low resilience (N = 210), (C) students with normal resilience (N = 916), and (D) students with high resilience (N = 206). * significant at p < 0.05, ** significant at p < 0.01, *** significant at p < 0.001, X, resilience; Y, engagement; M1, academic belonging; M2, social integration.
