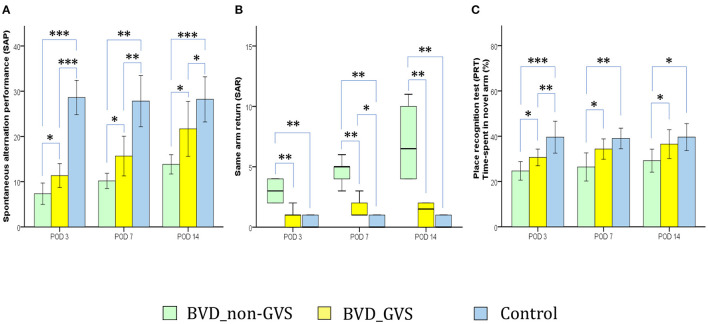
Figure 3.
Evaluation of locomotor activity and spatial navigation in the Y maze test. The spontaneous alternation performance (SAP), an indicator of spatial working memory and locomotor activity, was decreased in the BVD_non-GVS group compared with the control group on PODs 3 (p < 0.001, Bonferroni test), 7 (p < 0.001, Tamhane test), and 14 (p < 0.001, Bonferroni test). The values of the BVD_GVS group were better than those of the BVD_non-GVS group on PODs 3 (p = 0.018, LSD test), 7 (p = 0.049, Tamhane test), and 14 (p = 0.02, Bonferroni test) (A). The same arm return (SAR), which indicates the degree of attentional difficulty during active working-memory performance, was significantly higher in the BVD_non-GVS group than in the control group on PODs 3 (p = 0.005, Mann-Whitney U test), 7 (p = 0.005, Mann-Whitney U test), and 14 (p = 0.005, Mann-Whitney U test). The BVD_GVS group showed better values than the BVD_non-GVS group on PODs 3 (p = 0.006, Mann-Whitney U test), 7 (p = 0.004, Mann-Whitney U test), and 14 (p = 0.003, Mann-Whitney U test) (B). In the PRT, an indicator of spatial reference memory, the BVD_non-GVS group scored significantly worse than the control mice on PODs 3 (p < 0.001, Bonferroni test), 7 (p = 0.002, Bonferroni test), and 14 (p = 0.017, Bonferroni test). The PRT performance improved significantly in the BVD_GVS group, compared with the BVD_non-GVS group, on PODs 3 (p = 0.033, LSD test), 7 (p = 0.038, Bonferroni test), and 14 (p = 0.031, LSD test) (C). The SAP and PRT values are given as the mean ± SD, and the p values were calculated using one-way ANOVA with post-hoc tests. The SAR values are given as the median (95% confidence interval), and those p values were calculated using the Kruskal-Wallis test and Mann-Whitney U-test. *Significant differences between two groups: * p < 0.05; ** p < 0.01; *** p < 0.001.

