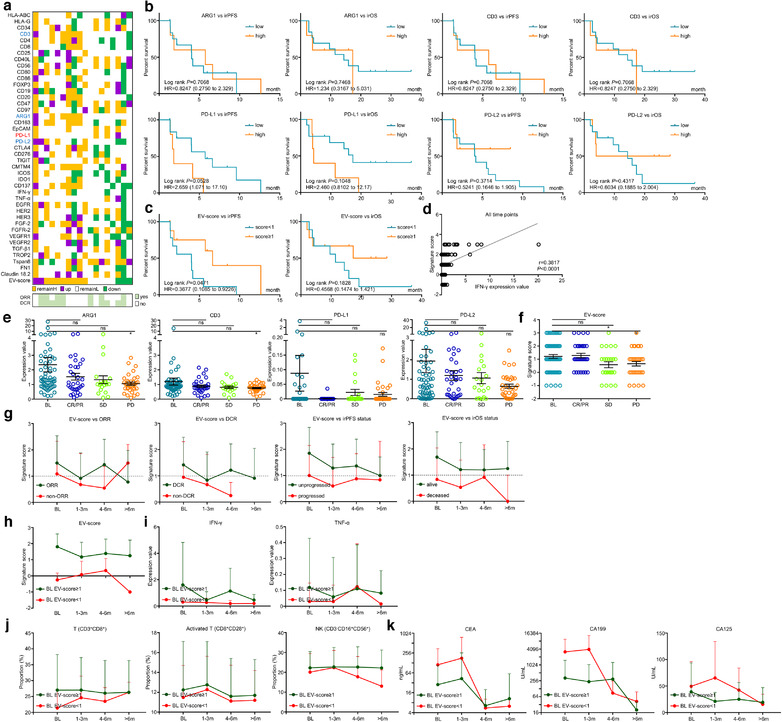
FIGURE 3.

EV‐score dynamically monitored ICI outcomes. (a) Fold changes of EV protein panel and score at 1 M compared with BL in 18 accessible patients. (b) The prognostic correlations of EV‐derived ARG1, CD3, PD‐L1, PD‐L2 and (c) EV‐score at 1 M were assessed by Kaplan‐Meier survival analysis. (d) Correlation between EV‐score and IFN‐γ level in paired peripheral blood samples for all time points. (e) Expressions of EV‐derived ARG1, CD3, PD‐L1, PD‐L2 and (f) value of EV‐score were compared at BL, CR/PR, SD, PD points. (g) Dynamic changes of EV‐score along with the timeline of ICI treatment were compared between patients with/without overall response, disease control, disease progression and cancer death. Dynamic changes of (h) EV‐score, (i) cytotoxic cytokines IFN‐γ/TNF‐α, (j) T cell (CD3+CD8+)/activated T cell (CD8+CD28+)/NK cell (CD3–CD16+56+) and (k) tumour markers CEA/CA199/CA125 along with the timeline of ICI treatment were compared between patients defined as BL EV‐score≥1 or BL EV‐score < 1. *, P < 0.05. ns, P value not significant
