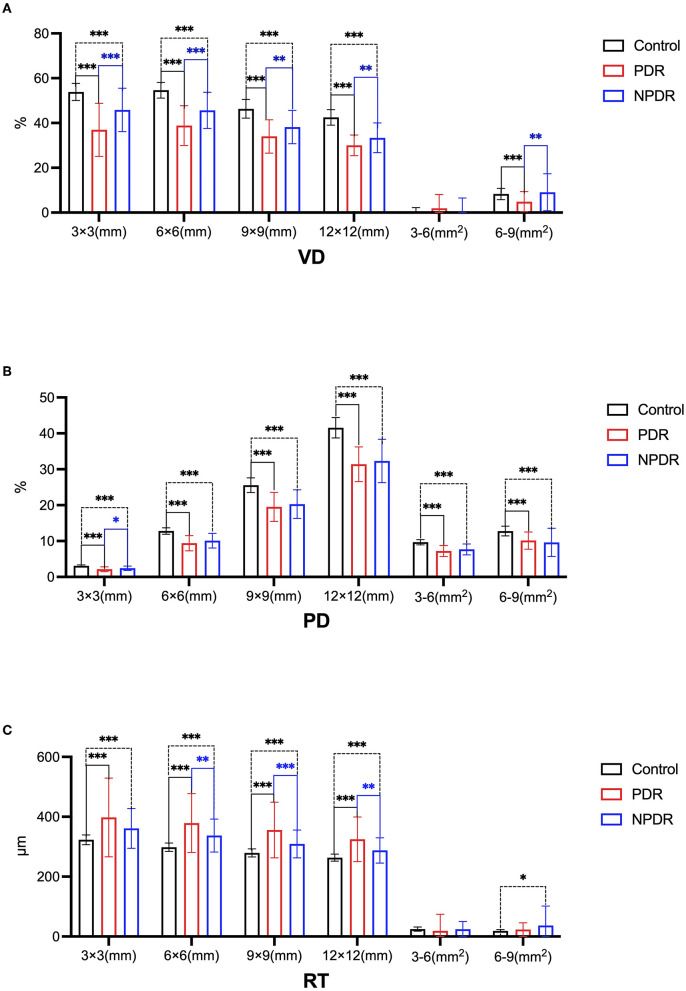
Figure 1.
The changes of the deep vascularcomplex in healthy control group, PDR group and NPDR group by SS-OCTA (*p ≤ 0.05,there is a statistical difference.**p ≤ 0.01, ***p ≤ 0.001, there is a significant difference). (A) Comparison of VD in 3 × 3 (mm), 6 × 6 (mm), 9 × 9 (mm), 12 × 12 (mm), 3–6 (mm2), and 6–9 mm (mm2) in the healthy controls, PDR and NPDR groups. (B) Comparison of PD in 3 × 3 (mm), 6 × 6 (mm), 9 × 9 (mm), 12 × 12 (mm), 3–6 (mm2), and 6–9 mm (mm2) in the healthy controls, PDR and NPDR groups. (C) Comparison of RT in 3 × 3 (mm), 6 × 6 (mm), 9 × 9 (mm), 12 × 12 (mm), 3–6 (mm2), and 6–9 mm (mm2) in the healthy controls, PDRand NPDR groups.

