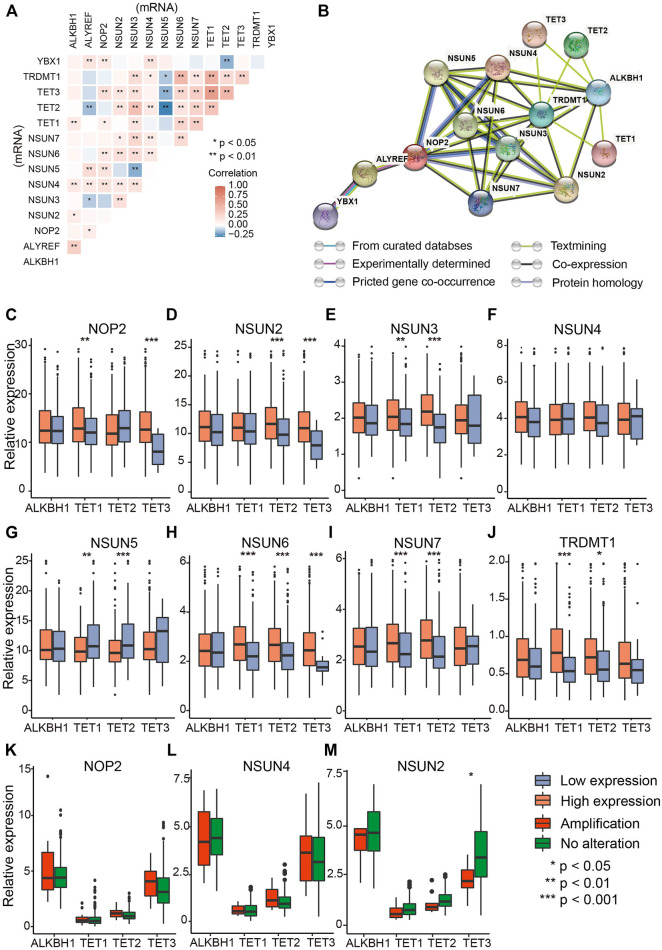
FIGURE 2.
The interaction and correlation analysis between RNA m5C regulators in ovarian cancer. (A) Correlation of mRNA levels among m5C regulators. (B) Protein–protein interaction plot among the 14 m5C regulators. (C–J) Correlations between “writers” (NUSN1, NSUN2, NSUN3, NSUN4, NSUN5, NSUN6, NSUN7, TRDMT1) and “erasers” (TET1, TET2, TET3, ALHBK1) at mRNA level (RPKM). (K–M) Differential mRNA levels of “erasers” between amplified type and wild type of “writers” with the highest CNV frequencies (NOP2, NSUN4, and NSUN2).

