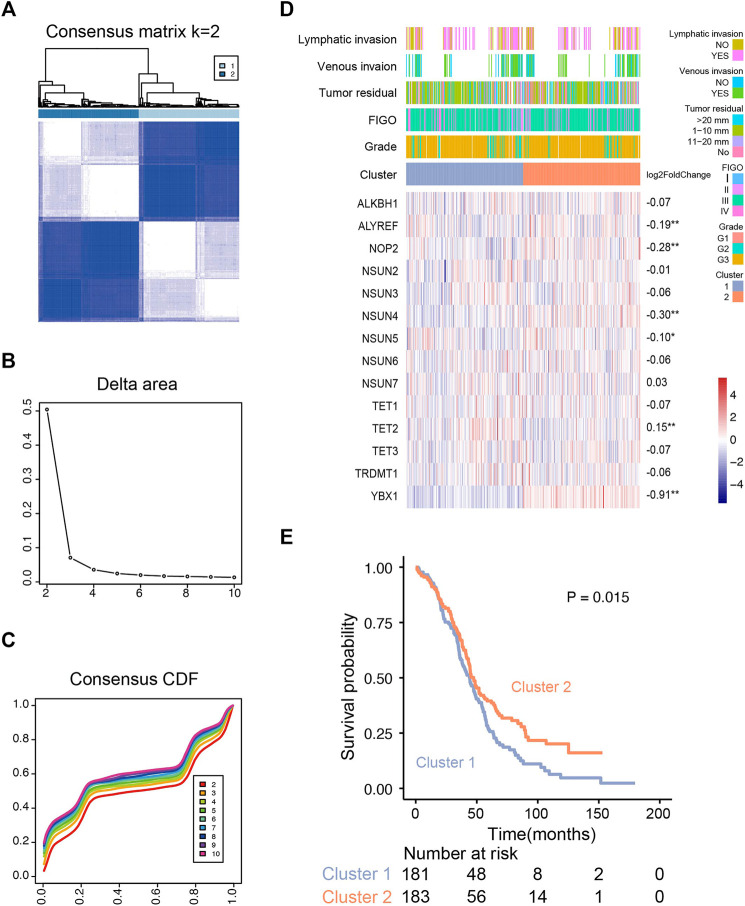
FIGURE 3.
Unsupervised consensus clustering analysis of RNA m5C regulators. (A) Consensus clustering matrix for the most suitable k (k = 2). (B) Relative changes in the area under the clustering cumulative function (CDF) curve at k = 2–10. (C) Consensus clustering CDF for k = 2–10. (D) The m5C regulator expression profiles and clinicopathological characteristics in two clusters. (E) Kaplan–Meier overall survival curves for ovarian cancer patients of two clusters in the TCGA cohort.

