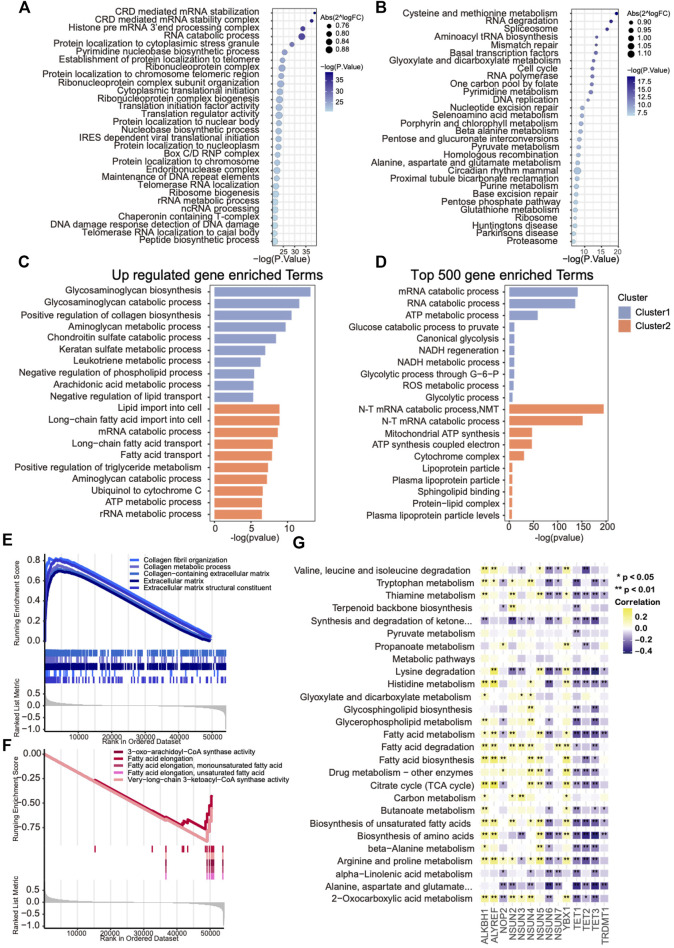
FIGURE 4.
Metabolic heterogeneity in ovarian cancers with distinct m5C modification patterns. (A,B) Bubble plot showing GSVA enrichment analysis of the top 30 changed GO and KEGG hallmark pathways between two m5C clusters. (C) The most enriched metabolism-related GO pathways using differentially expressed genes in each m5C cluster. (D) The most enriched metabolism-related GO pathways using the top 500 up-regulated genes in each m5C cluster. (E,F) GSEA analysis showing the significant metabolism-related pathways up-regulated in each m5C cluster. (G) Correlation analysis between GSVA enrichment scores of the changed metabolism-related pathways in each m5C cluster and mRNA levels of m5C regulators.

