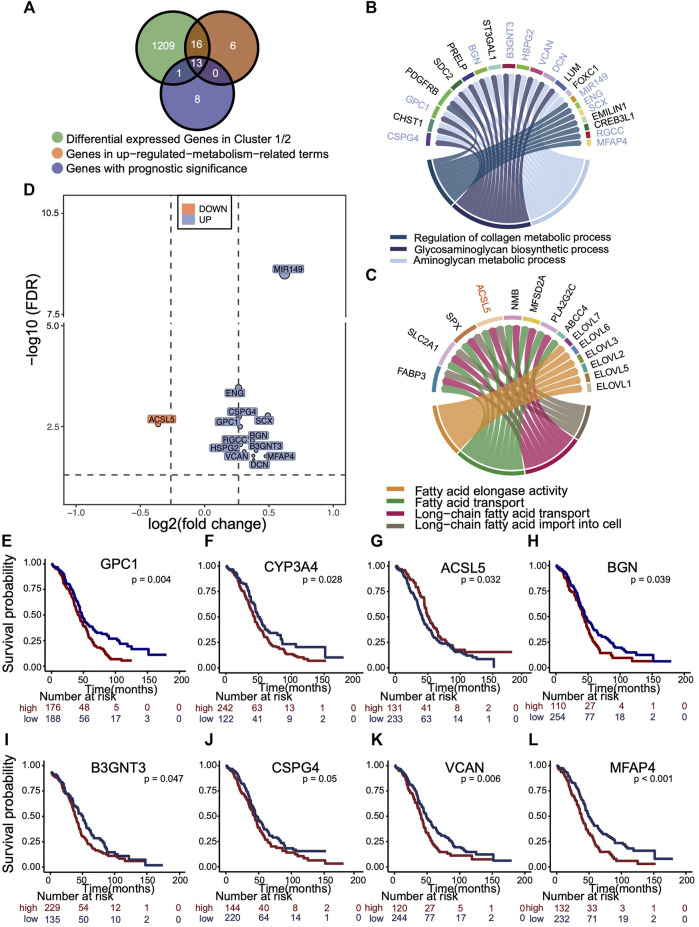
FIGURE 5.
Selection of representative genes differentially expressed in m5C cluster, related to metabolism and with prognostic significance. (A) Venn plot showing the overlapping analysis of genes that were differentially expressed (fold change >1.5 and p < 0.05) in two clusters, enriched in up-regulated metabolic pathways in each cluster, and had the prognostic significance. (B,C) Circus plot exhibiting the metabolic pathways up-regulated in each m5C cluster and those 13 genes with prognostic value were marked. Blue, up-regulated in cluster 1. Orange, up-regulated in cluster 2. (D) Volcano plot distributes the relative expressions 13 representative genes with log2 (fold change) and log10 (FDR). The reference is gene expression of cluster 1. Blue, up-regulated in cluster 1. Orange, up-regulated in cluster 2. (E–L) Kaplan–Meier overall survival curves of eight representative genes.

