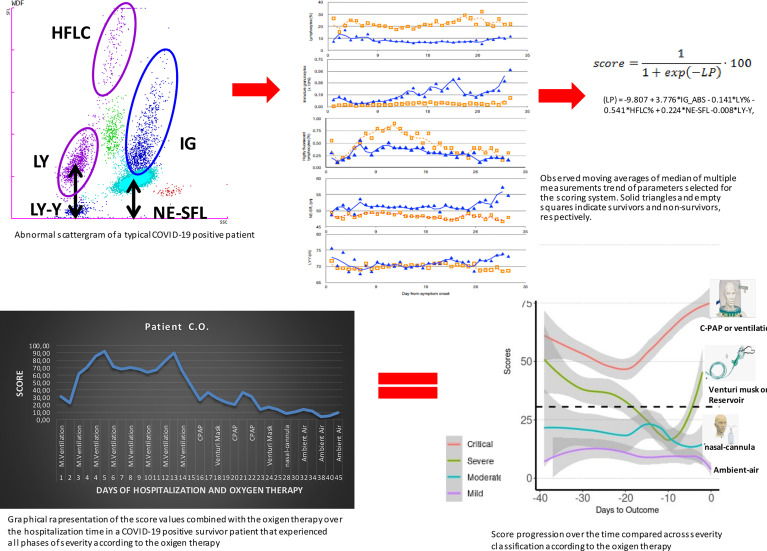
Figure 5.
Graphical representation of the entire logical hypothesis of the study starting from the typical abnormal scattergram of a COVID-19-positive patient from which have been selected the 5 predictors of the score. The analysis of data of the five parameters gave the moving averages of median that can clearly show differences between survivors and non-survivors. The accurate statistical analysis provided the final score that has been combined to the severity of patients according to the symptomatic OXY therapy administered. Finally, the combination of all what above described into the graphical representation of a COVID-19 patient over the time of 45 days of hospitalization that went through different phases of the disease severity according to the OXY therapy that show the solid power of the score in representing, preceding, and explaining the course of the disease from the immunological point of view.

