Figure 2.
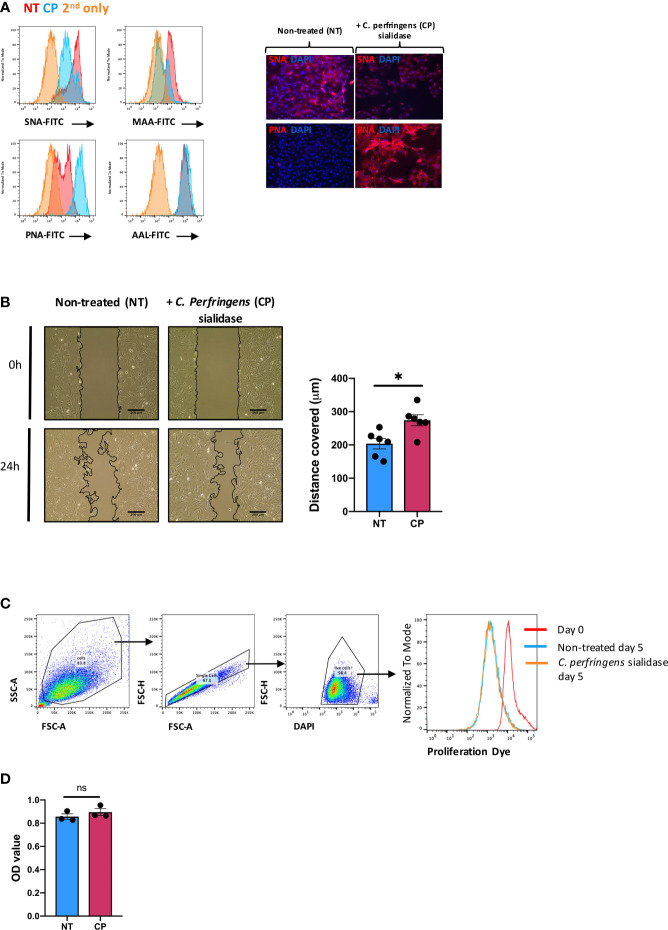
In vitro desialylation enhances SFs motility. SFs isolated from naïve mice were cultured and expanded ex vivo. Cells were cultured to reach confluency and then treated with 0.1U/ml of C. perfringens sialidase (CP) for 1 hour to remove sialic acid from cell surface. (A) Control and sialidase-treated cells were stained with biotinylated lectins (SNA, MAA, PNA and AAL), followed by incubation with Alexa-647 streptavidin. Cells were then examined by flow cytometry to quantify lectin binding, as shown in histograms. Images were acquired in an EVOS™ FL Auto microscope, showing SNA and PNA-stained cells. Error bars: 200 μm. (B) SFs were seeded in migration chambers and grown until monolayer confluence to conduct migration assays. Images show one representative experiment, including control and sialidase-treated naïve SFs when insert was removed (time 0, T0) and 24 hours after desialylation (T24). Superimposed black lines define the cell-free area, scale bar: 200 μm. Column graph show the mean migration distance of 5 independent experiments, showing non-treated (NT) and sialidase-treated (CP) cells. Error bars represent SEM, each dot represents one independent experiment (n = 5), *p < 0.05 by Mann-Whitney test. (C) SFs were labelled with proliferation dye eFluor 670 and analysed directly by flow cytometry (Day0) or treated with sialidase and maintained in culture for 5 days (Day5). Histogram shows one representative experiment. (D) Naïve SFs were seeded in 96-well plates, treated with sialidase and maintained in culture condition to assess cell viability and metabolomic activity using a colorimetric MTS assay. Each dot represents one independent experiment (n = 3) analysed in technical triplicate, error bars represent SEM, ns, non-significant, by Mann-Whitney test.

