Figure 3.
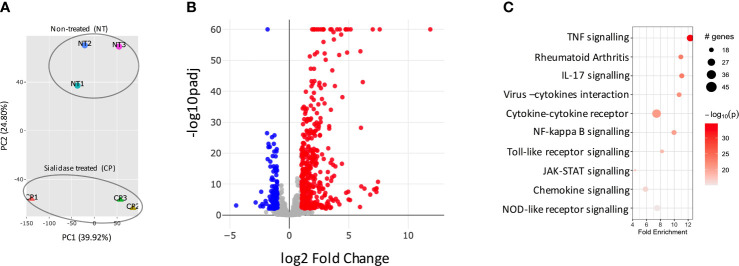
Sialidase-treated SFs show an inflammatory transcriptomic profile. SFs from naive mice were cultured and expanded ex vivo, RNA was isolated from non-treated control (NT) and C. perfringens sialidase treated (CP) SFs, then subjected to bulk RNA-Seq (75bp paired-end, 30M reads, n = 3). (A) Principal component analysis (PCA). (B) All detected genes are plotted as a volcano plot. Genes that passed a threshold of padj < 0.01 and |foldChange| > 2 are considered differentially expressed genes (DEGs), comparing sialidase-treated and non-treated SFs. Colour code, red: upregulated, blue: downregulated, in CP treatment. (C) Upregulated genes in sialidase treatment identified in (B) were used to perform KEGG pathway enrichment analysis. KEGG pathways are plotted in bubble chart with fold enrichment on x-axis and -log10 p-value on the coloured scale. The size of bubble is proportional to the number of DEGs in the given pathway.

