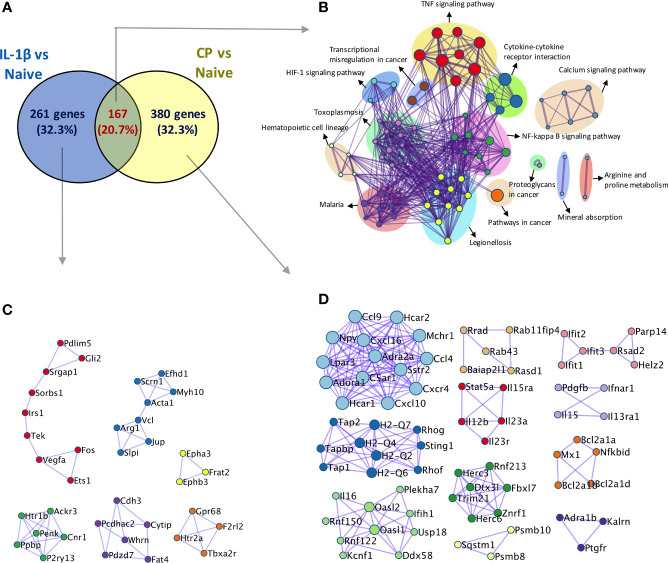
Figure 6.
Comparison of transcriptomic activation of desialylated and IL-1β-stimulated SFs. Bulk RNA-Seq (75bp paired-end, 30M reads, n = 3) was performed on i) naïve and IL-1β-stimulated, and ii) non-treated and C. perfringens-treated naïve SFs, to identify DEGs (Padj < 0.01 and |foldchange| > 2) in both experimental conditions. (A) Venn diagram shows the number of overlapping and unique DEGs identified in the IL-1β vs naïve and CP vs NT comparisons. (B) Overlapping genes identified in (A) were used to perform pathway enrichment using the bioinformatics tool Metascape. (C) Unique genes in IL-1β vs naïve and (D) unique genes in CP vs NT identified in (A) were used to perform protein-protein interaction enrichment in Metascape.

