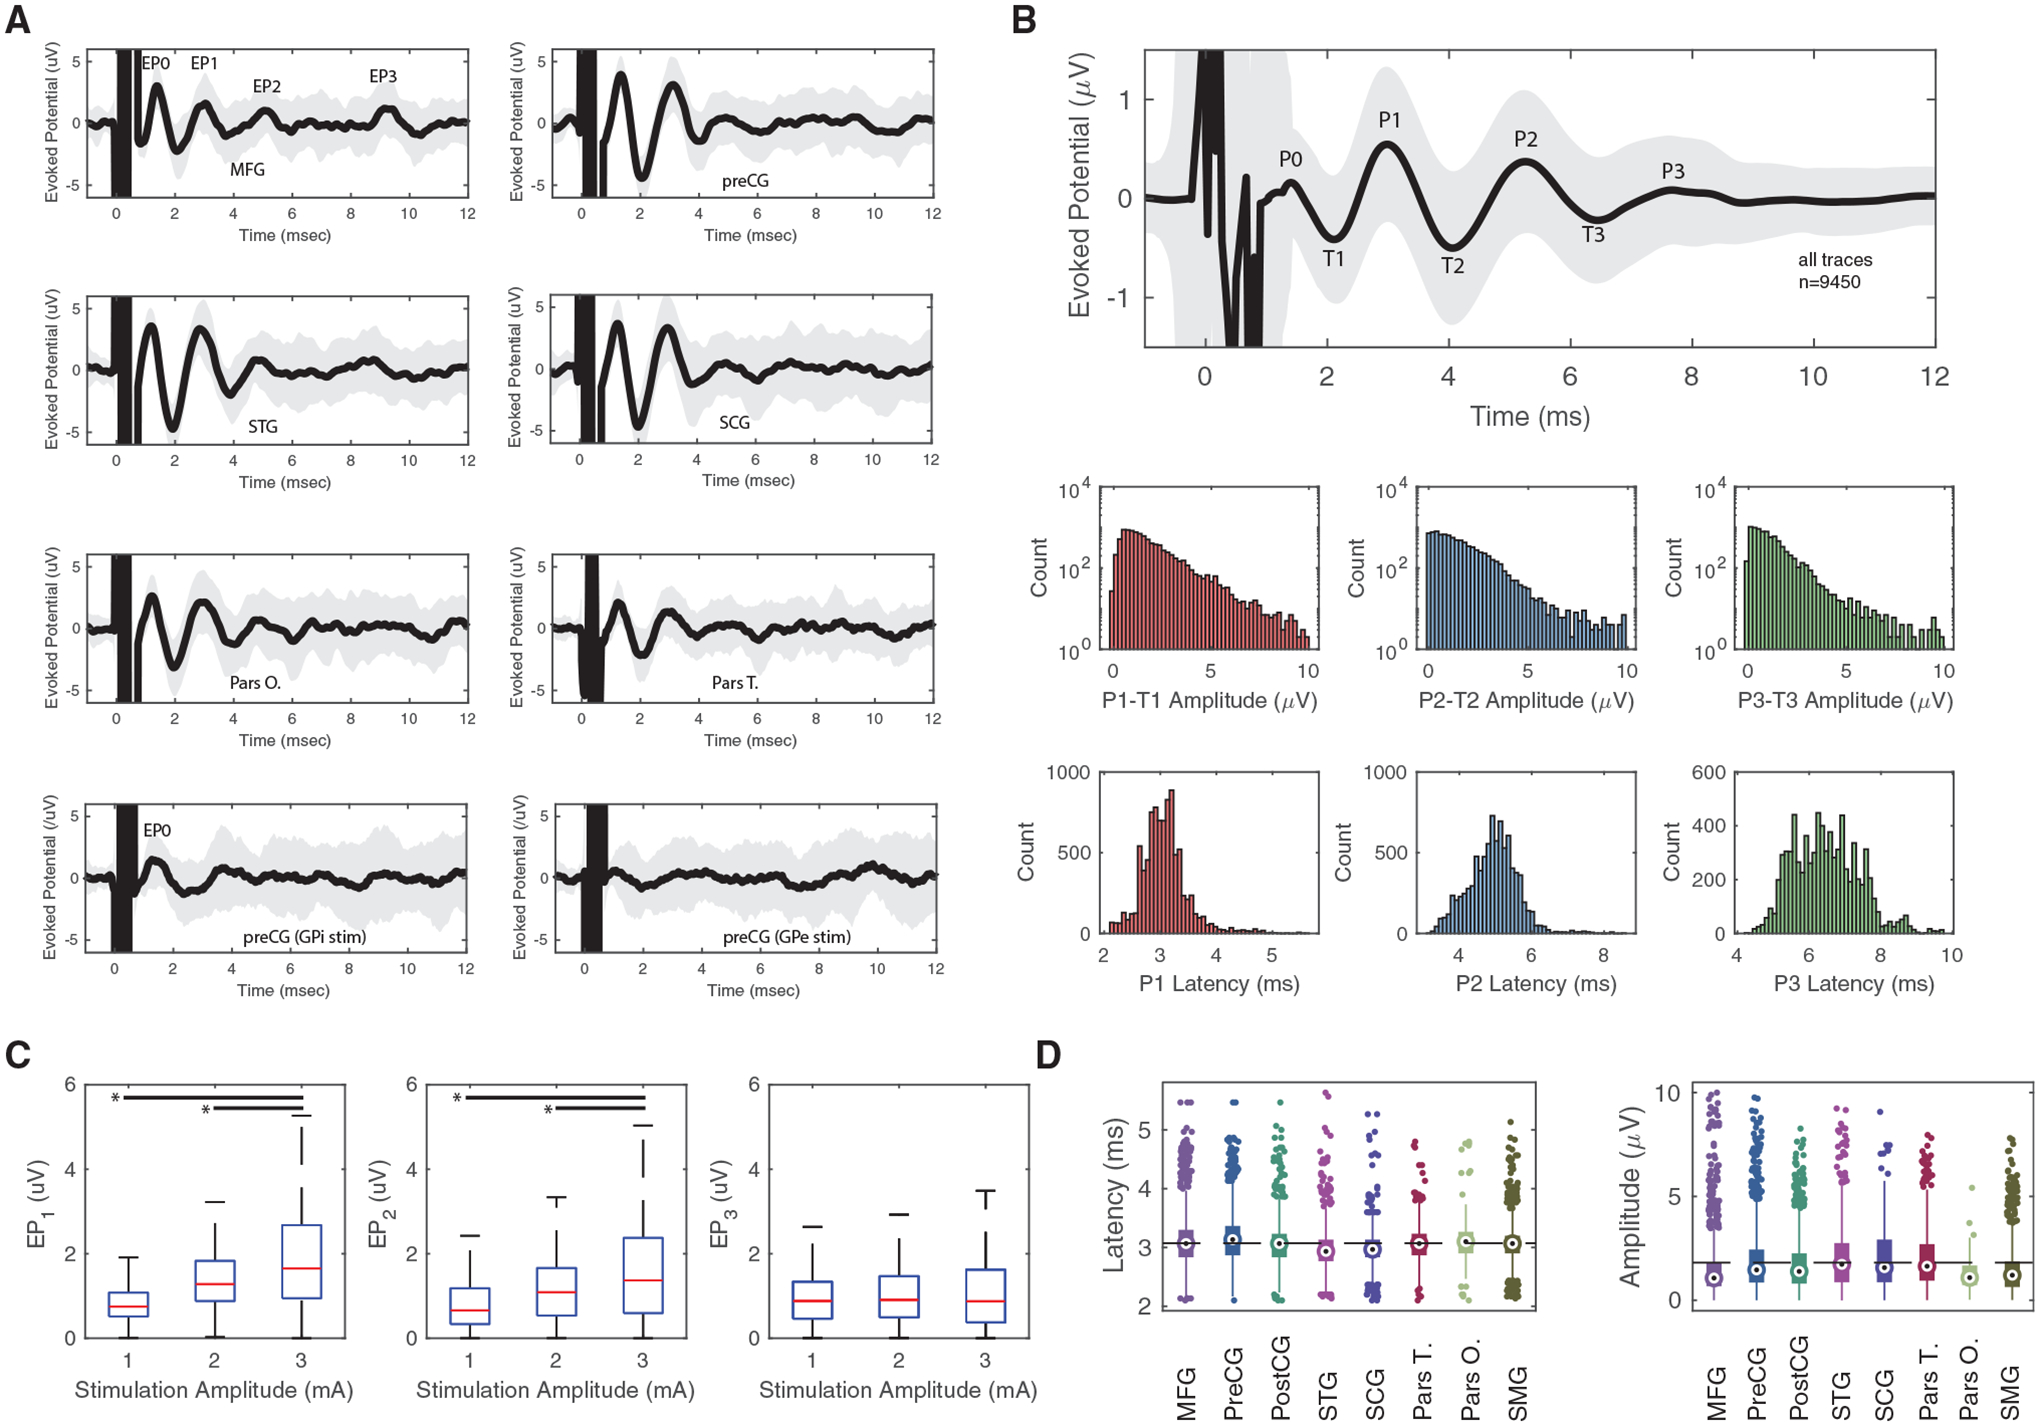
Figure 2. Characterization of cortical EPs.

(A) Examples of 3 mA STN (top six subpanels) and GP (bottom two subpanels) stimulation in a single subject for different brain gyri. GPi stimulation elicited an EP0 consistent with its proximity to the internal capsule but no appreciable EP1–EP3. GPe stimulation elicited no EPs. The thick black line and the gray region correspond to the mean and standard deviation, respectively, of the cortical EP of 30 stimulation trials for one subject and one stimulation location. Stimulation occurred at time 0. EP0 corresponds to the peak associated with very short EPs, while EP1–EP3 corresponds to the peaks involved with the hyperdirect pathway.
(B) Top panel: averaged EP peaks (P) and throughs (T) after STN stimulation for all traces. Mean is presented as a black line, and standard deviation is presented as a gray shadow. Bottom panels: amplitude and latency distribution of the difference between peaks and troughs for EP1–EP3.
(C) EP amplitude changes are plotted with interquartile ranges as a function of stimulation amplitude for different EP peaks. *, significant difference in an ANOVA test.
(D) EP1 latency and amplitude distribution plotted as a function of cortical area for latency and amplitude for all traces. Circle represents median, rectangle represents 25–75 quantiles, and the thin line represents upper and lower quartiles.
