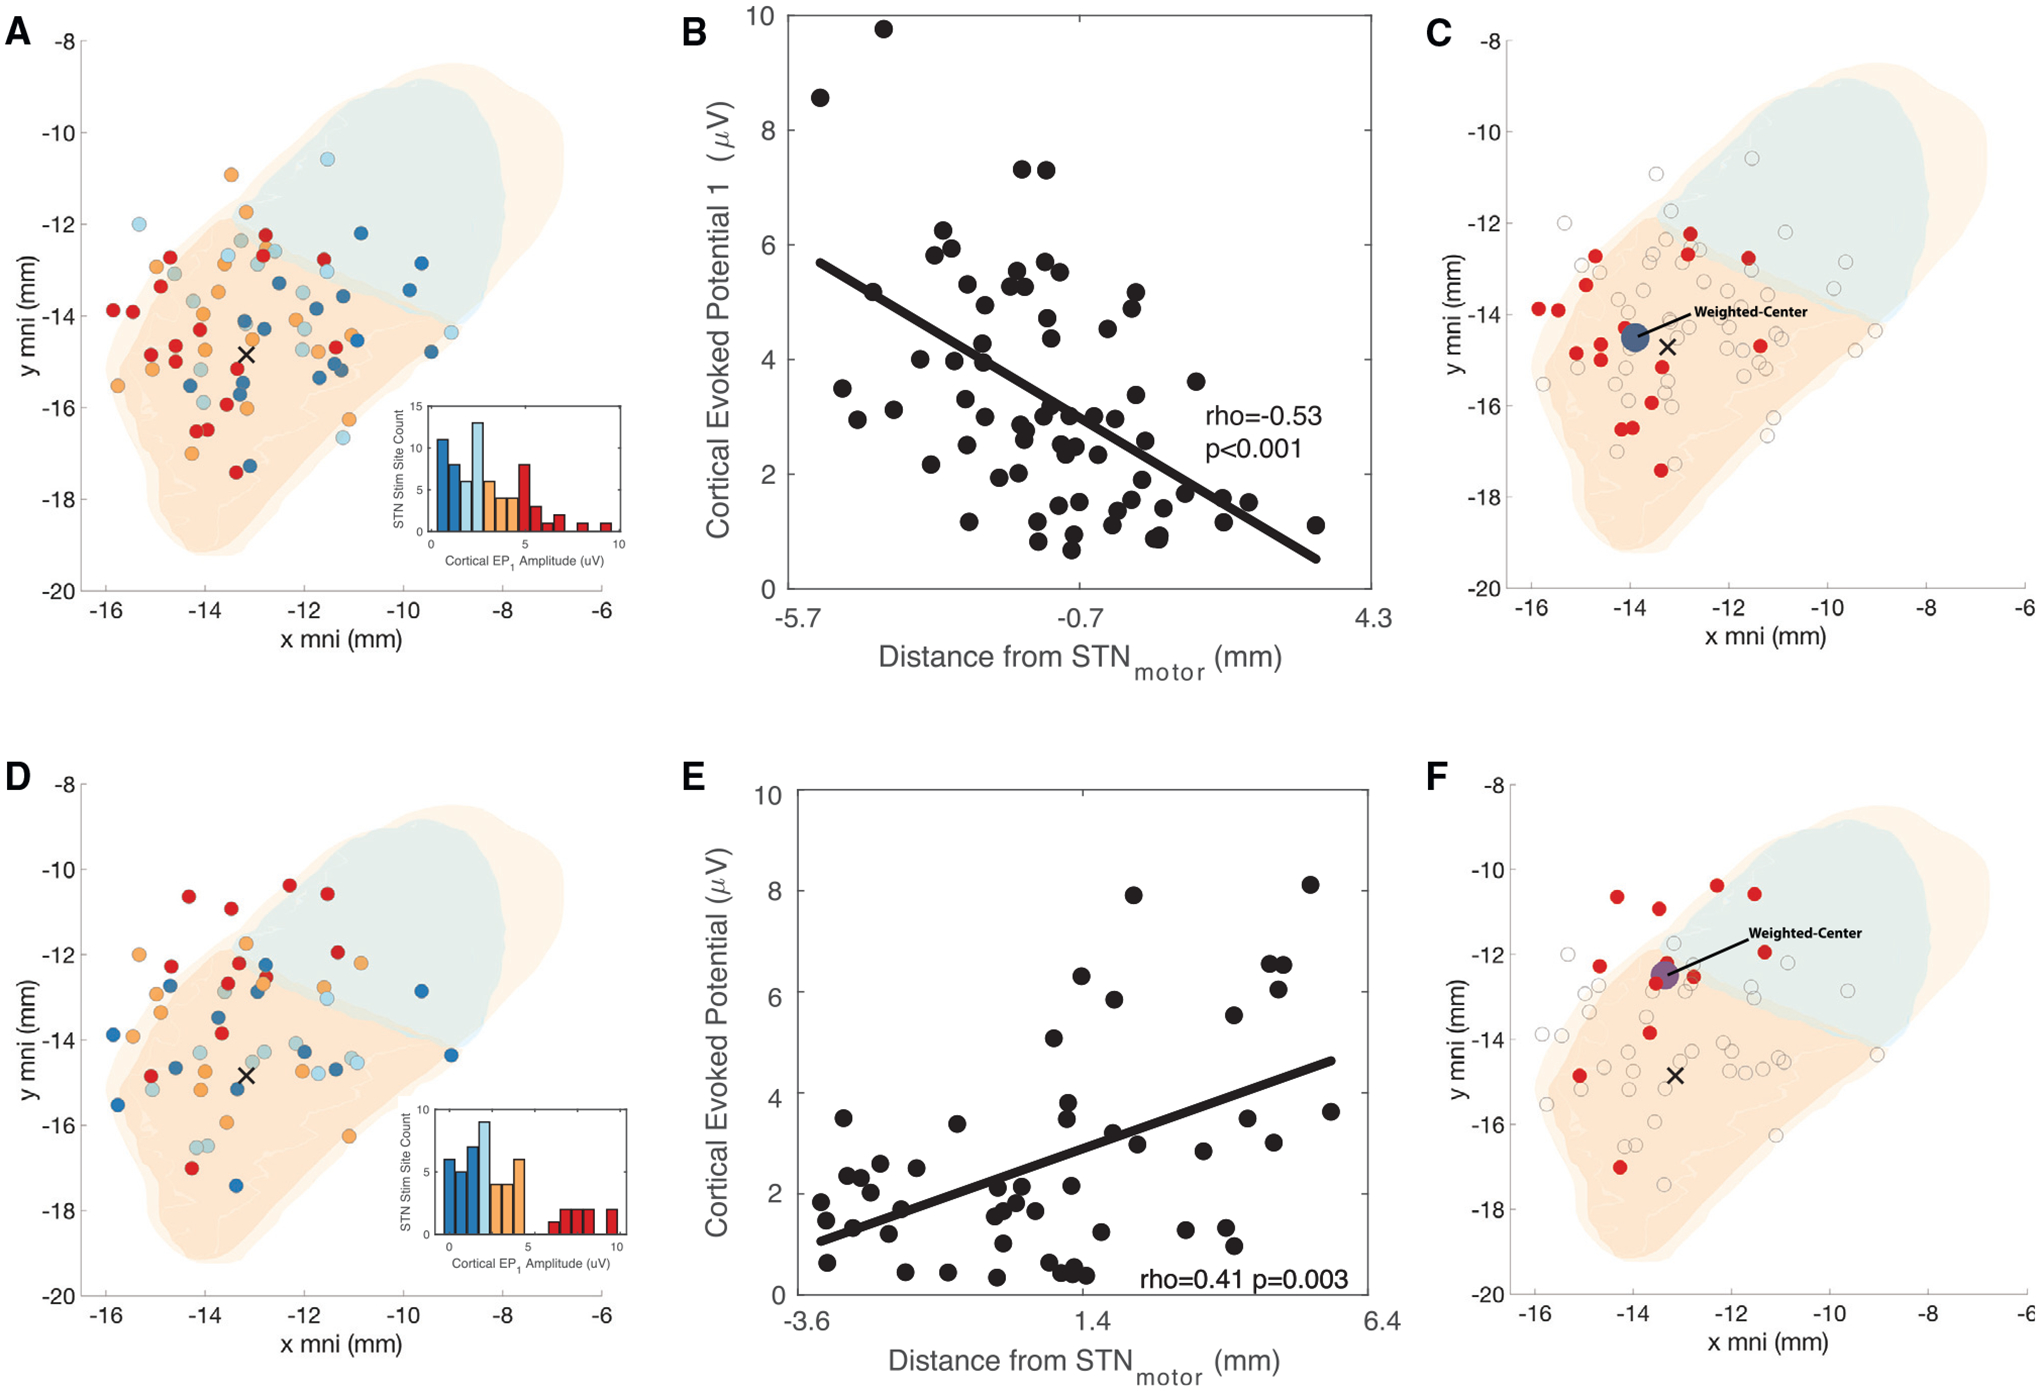
Figure 3. Cortical EPs projected onto the STN.

(A–E) Average values from all cortical recording sites in each region were averaged to one single value and plotted on each STN stimulation site for the precentral gyrus (A–C) and the middle frontal gyrus (D–E).
(A) Individual STN stimulation site and projected average precentral gyrus cortical EP in color representing interquartile voltage measures (dark blue, 1st quantile, light blue, 2nd quantile, orange, 3rd quantile, and red, 4th quantile; x represents the center of motor STN).
(B) All precentral gyrus cortical EP projected onto the defined one-dimensional STN axis.
(C) Weighted center of EP response for the upper quartile of precentral cortical EPs.
(D–F) Similar representations as previous panels but projecting the cortical EP from the MFG. The motor aspect of the STN is colored in orange, associative in green, and limbic in yellow, in panels (A), (C), and (D), respectively.
(F) Some points are outside the STN because representation in group space can distort the relation to the patient specific anatomy, and some contacts are outside of the STN. The diameter of each microelectrode tract at the level of the stimulation contact is 1.27 mm.
