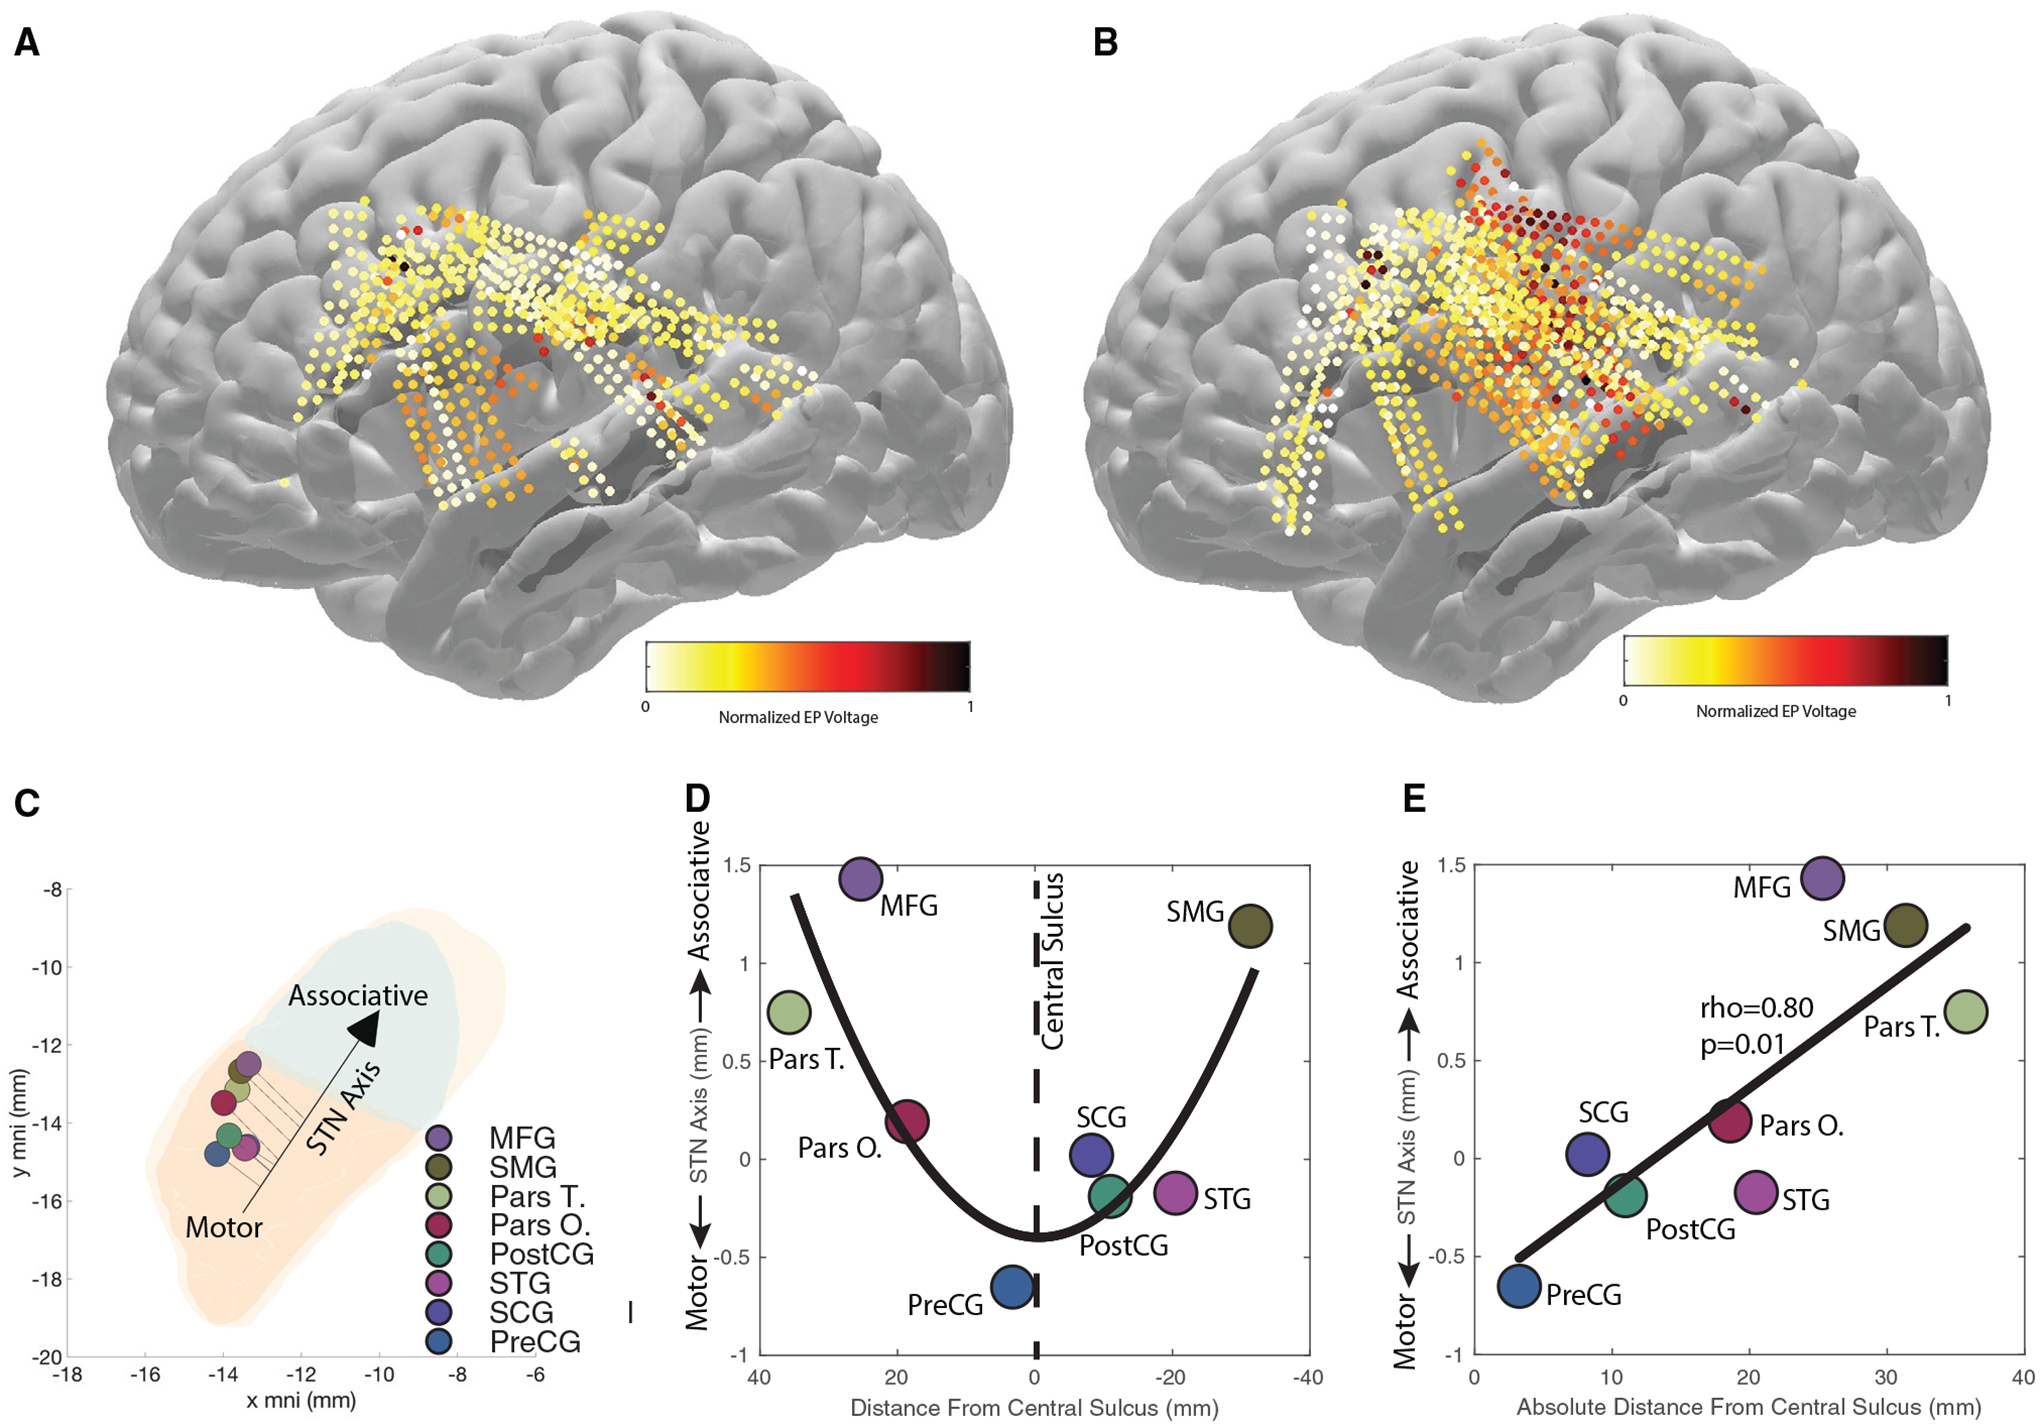
Figure 4. EP amplitude as a function of STN stimulation location.

(A) EP amplitude for STN stimulations closer to the STN associative center (the quantile containing the most frontomedial stimulation locations in the STN).
(B) EP amplitude for STN stimulations closer to the STN motor center (the quantile containing the most posterolateral stimulation locations in the STN). Electrodes that did not show an EP are not shown.
(C) Weighted center of cortical EP in the STN per cortical area, and motor aspects of the STN are colored in orange, associative in green, and limbic in yellow. A correlation between stimulation locations along the STN and recording locations along the cortex was found (D) that we simplified, due to the complex geometry, with a linear model of the absolute distance from the central sulcus on the cortical surface of the brain (E).
(D) The quadratic relationship between the STN center of voltage and the corresponding cortical location on the y MNI axis (p = 0.003).
(E) The linear model results depicting a significant relationship between STN center of voltage and the absolute distance from the central sulcus (p = 0.01).
