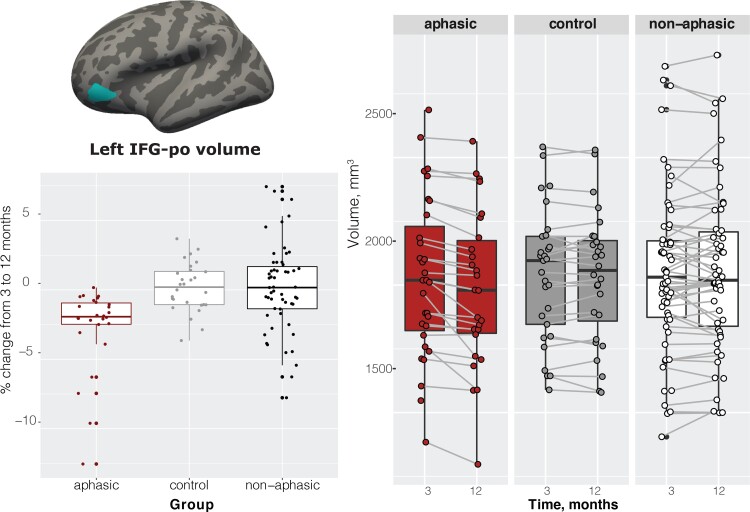
Figure 3.
GM imaging results. Location of the left IFG, pars orbitalis (IFG-po); per cent change between 3 and 12 months by group; left IFG-po volume by time by group. ANOVA on 3–12 months volume change—F(2,108) = 8.84, P = 0.0003, aphasic versus healthy controls (P = 0.0033), aphasic versus non-aphasic stroke (P = 0.0003), healthy control versus non-aphasic (P = 0.9866).

