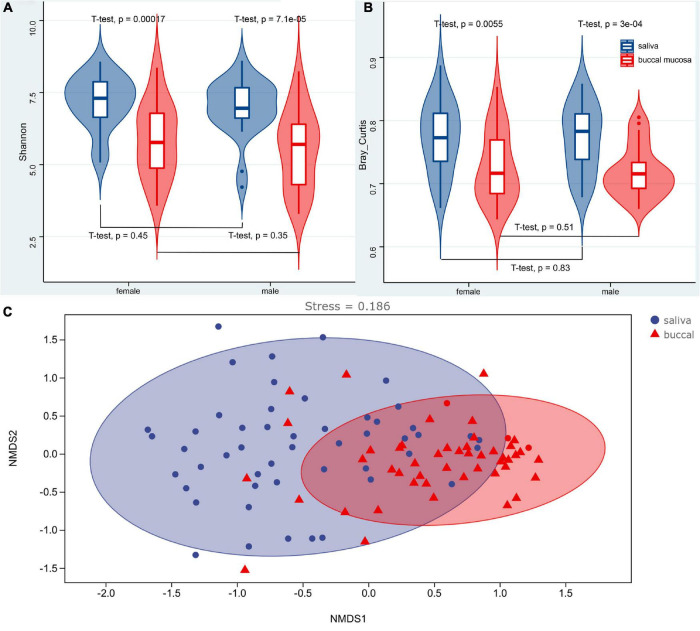
FIGURE 3.
Violin boxplot of the Shannon index (A), Bray–Curtis distance (B), and the NMDS analysis (C) of the saliva and buccal mucosa. A significant difference (p < 0.05) was observed between the saliva and buccal mucosa groups, while variations were not observed with regard to sex (p > 0.05). NMDS analysis based on the Bray–Curtis distance showed dense clustering in the buccal mucosa but a more dispersed pattern in the saliva without strong clustering, and overlaps were observed between the saliva and buccal mucosa groups.

