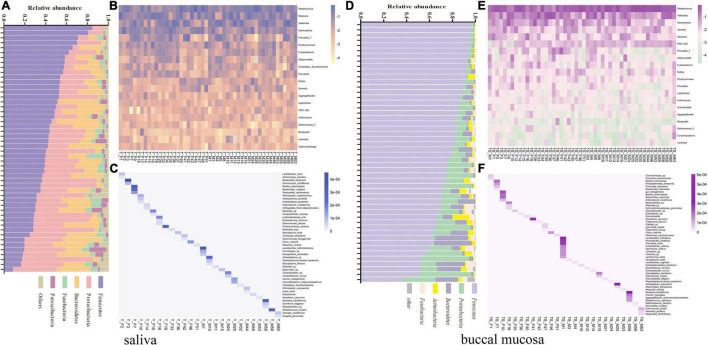
FIGURE 6.
(A) Relative abundance of the five major bacterial phyla of all individual saliva samples, sorted by decreasing Firmicutes content. (B) Heatmap of the top 20 bacterial genera of all individual saliva samples according to the raw relative abundance. (C) Heatmap of the relative abundance of 47 specific bacterial species among 26 individual saliva samples according to the raw abundance value. (D) Relative abundance of the five major bacterial phyla of all individual buccal mucosal samples, sorted by decreasing Firmicutes content. (E) Heatmap of the top 20 bacterial genera of all individual buccal mucosal samples according to the raw relative abundance. (F) Heatmap of the relative abundance of 47 specific bacterial species among 26 individual buccal mucosal samples according to the raw abundance value.

