Figure.
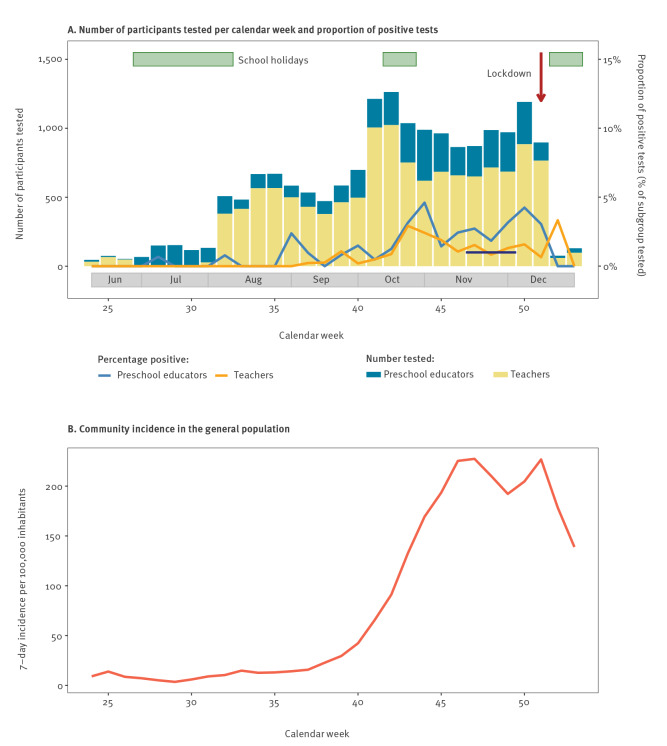
Proportion of positive tests of SARS-CoV-2 infection among educational staff and community incidence in Berlin, Germany, June–December 2020 (n = 17,448)
SARS-CoV-2: severe acute respiratory syndrome coronavirus 2.
Panel A shows the number of participants tested for SARS-CoV-2 per calendar week as well as the proportion of educational staff who tested positive. School holidays are indicated by green bars. The red arrow indicates the ‘lockdown light’ in Berlin, which took effect on 2 November 2020. The black line indicates the proportion of SARS-Cov-2 infected individuals in a population survey in central Berlin during the respective sampling period [10]. Panel B shows the community incidence in Berlin as the 7-day incidence per 100,000 inhabitants. Data was provided by the Senate of Health and Social Affairs, Berlin (LAGeSo) [8].

