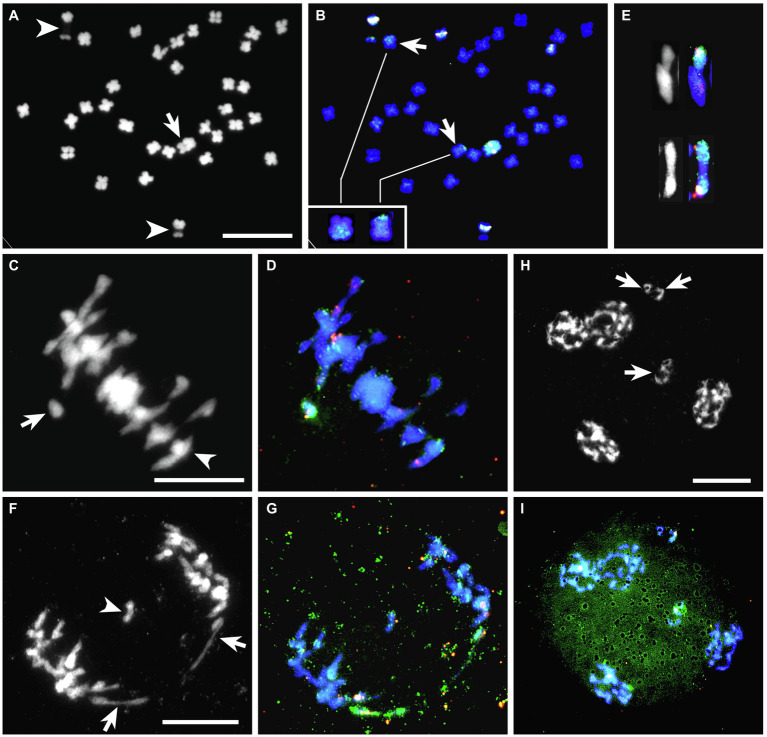
Figure 2.
BC2-126 sequential FISH-GISH results with 5S rDNA (pink, white) and T. ambiguum genomic DNA (green). (A,B), A somatic cell (A) DAPI stained (gray scale) and (B) the same cell after FISH-GISH. In (A), the arrow depicts a single T. ambiguum chromosome, and arrowheads show NOR-chromosomes from T. repens or T. occidentale. In (B), the arrows show recombinant chromosomes, which are magnified in the inset. (C,D), A meiotic metaphase I (MI) cell with the same probes as in (A,B). In (C), the arrow shows the unpaired T. ambiguum chromosome as a univalent and the arrowhead marks a trivalent involving two recombinant chromosomes and a 5S rDNA-bearing chromosome from T. repens or T. occidentale. (E), Cut-outs from other MI cells of a trivalent (top) and a bivalent (bottom) involving T. ambiguum or recombinant chromosomes. (F,G), Anaphase I cell with the same probes as in (A,B). In (F), the arrows show the two halves of the T. ambiguum chromosome which has undergone precocious separation of the sister chromatids (PSSC) and the arrowhead marks a laggard chromosome. (H,I), A telophase II with the same probes as in (A,B). In (H), the arrows mark micronuclei with chromosomes likely to be eliminated from the gametes. In (I), the elimination of the lone T. ambiguum chromosome is shown. Bars 10 μm.

