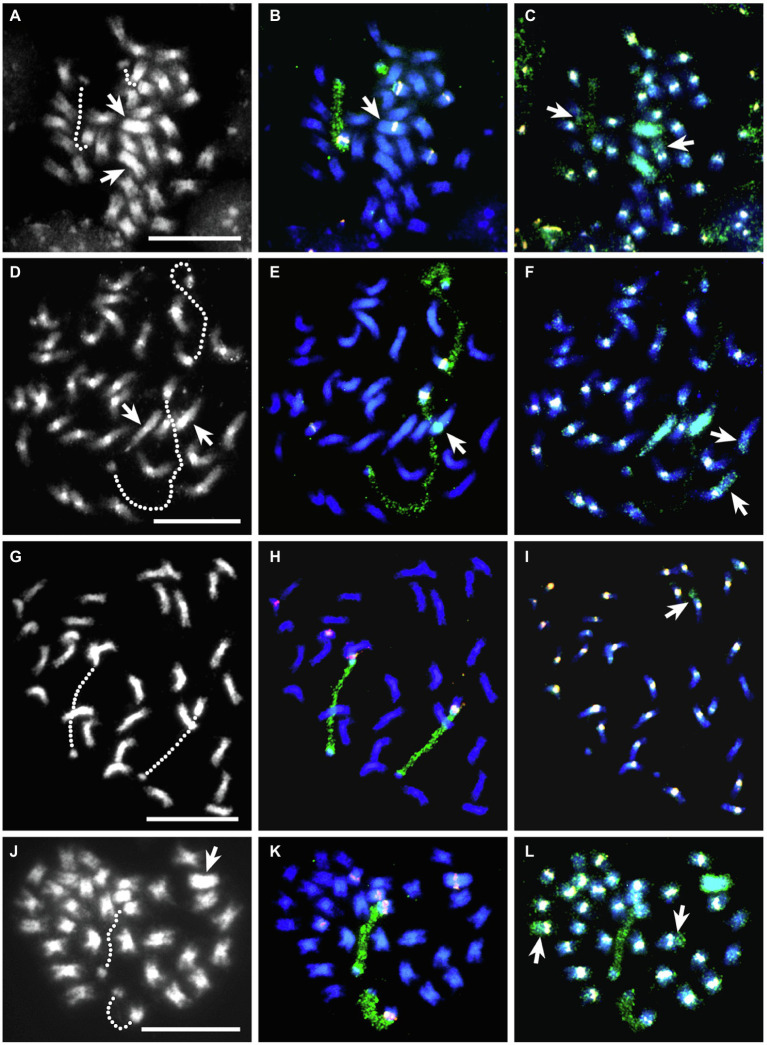
Figure 3.
FISH-GISH results for somatic cells of four interspecific hybrids. The left column is DAPI stained (gray scale), the center column the same cell with 5S rDNA (pink) and 18S rDNA (green) FISH probes and the right column the same cell with sequential FISH-GISH using the centromeric probe TrR350 (white) and T. ambiguum genomic DNA (green). Hatched lines in the left column show the decondensed NOR-regions of each pair of NOR-chromosomes from T. repens or T. occidentale that show as green 18S rDNA signals in the middle column. (A–C), BC1-120; in (A), the arrows show two large T. ambiguum chromosomes that were apparent following GISH in (C). In (B), the arrow indicates that one of the T. ambiguum chromosomes carried a 5S rDNA signal. In (C), the arrows mark recombinant chromosomes, one of which lacks a TrR350 centromeric signal. (D–F), BC1-132; in (D), the arrows show two large T. ambiguum chromosomes that were apparent following GISH in (F). In (E), the arrow shows that one of the T. ambiguum chromosomes carried a condensed NOR region (detected by the 18S rDNA probe). In (F), the arrows mark recombinant chromosomes, one of which has a very weak TrR350 centromeric signal. (G–I), Kopu II × BC1-132; in (I), the arrow shows a recombinant chromosome. (J–L), BC2-133; in (J), the arrow shows a large T. ambiguum chromosome which is visible in (L) and carries a 5S rDNA signal (K). In (L), the arrows show two recombinant chromosomes, both with strong centromeric TrR350 signals. Bars 10 μm.

