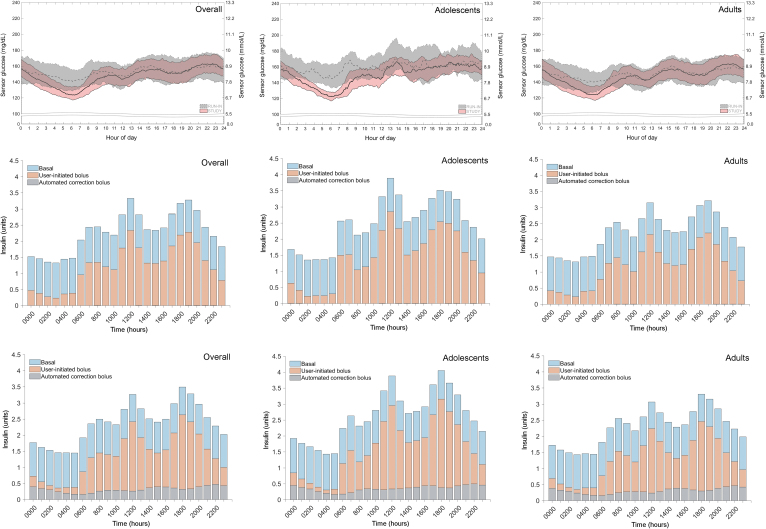
FIG. 4.
SG and insulin delivered profiles, during the run-in period and study phase. The median and IQRs of SG levels (top panel) and the units of insulin delivered during the run-in period (middle panel) and study phase (bottom panel), across the 24-h day for the overall, adolescent (14–21 years), and adult (>21–75 years) groups are shown. For SG, medians (solid), and IQR intervals (dotted) of the run-in period (gray) and study phase (pink) appeared to vary most during the nighttime period (12 AM–6 AM). For insulin delivered, the units of total basal (blue), user-initiated bolus (orange), and automated correction bolus (gray) are shown. The study phase Auto Correction bolus averaged 20% of total bolus for all groups. System use during the run-in period included SAP, PLGM, or Auto Basal therapy, whereas that for the study phase included Auto Basal and Auto Correction. During baseline run-in period, Auto Correction bolus was inadvertently delivered on six systems. IQRs, interquartile ranges; SG, sensor glucose.

