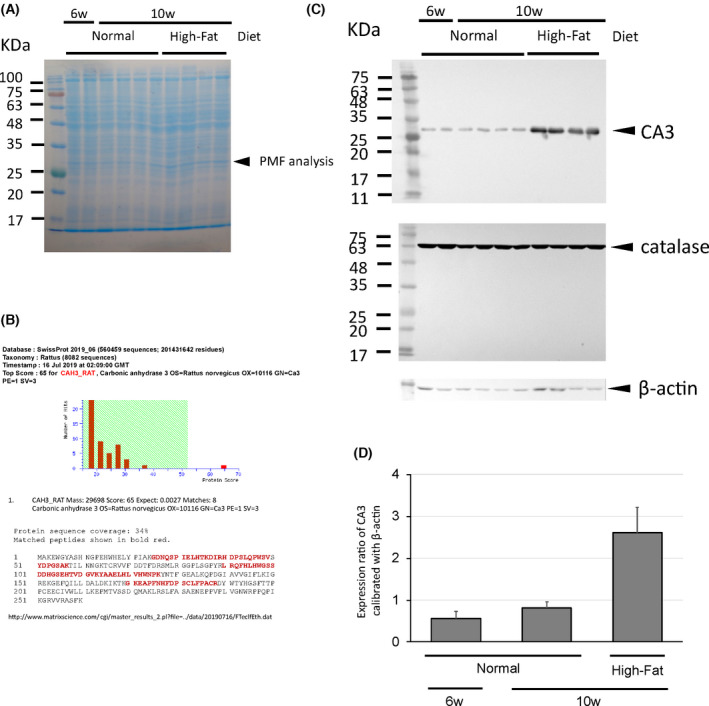
Fig. 2.

Expression of CA3 in fatty liver induced by the consumption of a high‐fat diet. (A) Changes in protein expression after consumption of a high‐fat diet for four weeks (SDS/PAGE analysis). (B) The search results of the Mascot program. The fingerprinting analysis yielded a match for rat carbonic anhydrase 3, with a significant score of 65 (P = 0.0027). The sequence coverage was 34%. (C) Western blot analysis for the expression of CA3, catalase, and β‐actin in the liver. (D) Catalase and β‐actin were used as controls. The CA3 band density was measured using imagej, calibrated against β‐actin. Data presented are mean ± SD density (n = 4 or 8).
