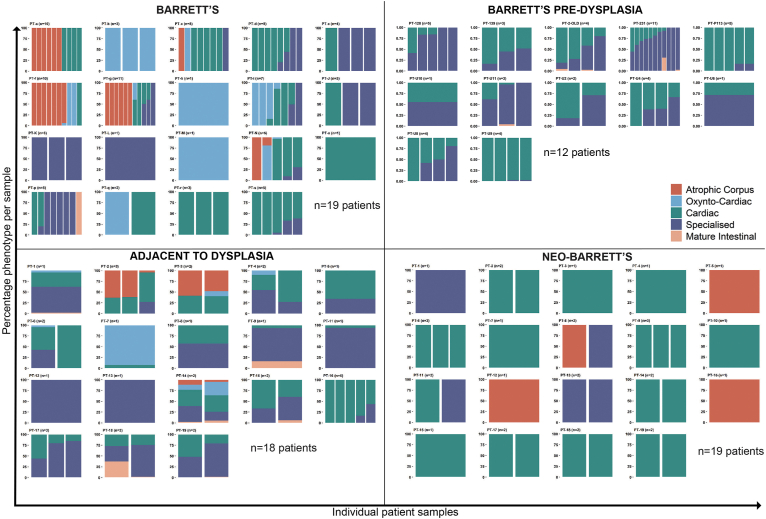
Supplementary Figure 10.
A per-patient analysis of observed gland phenotypes. Phenotypic diversity within nondysplastic BE (top left), predysplastic BE (top right) adjacent to dysplasia, BE (bottom left), and neo-BE (bottom right). Each column represents a single biopsy taken at a known site within the esophagus.

