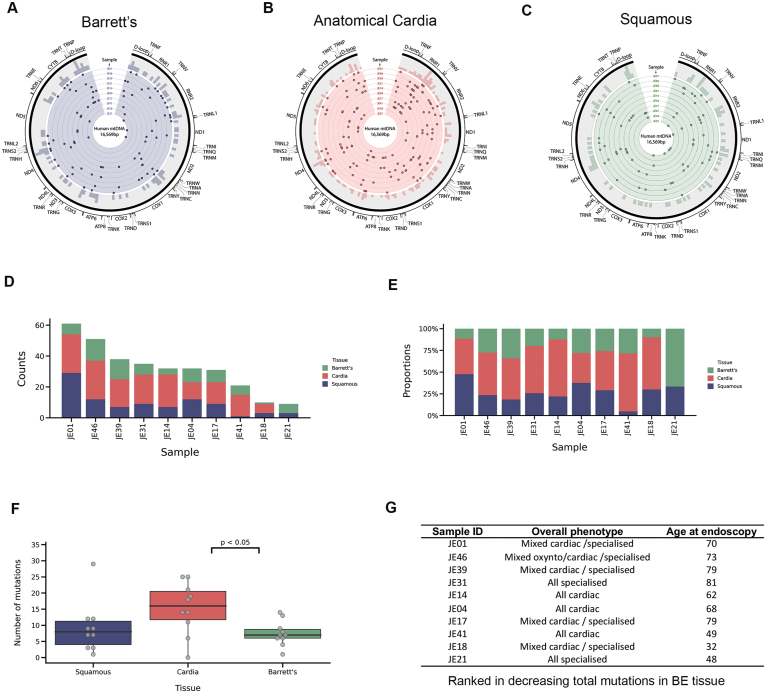
Supplementary Figure 7.
NGS of BE, gastric cardia, and adjacent squamous mtDNA from matched patients. (A–C) Circos plots showing the distribution of all somatic variants in (A) Barrett’s epithelium, (B) anatomic gastric cardia epithelium, and (C) squamous. n = 10 for each. (D, E) Mutation burden as per (D) normalized mutation count for each tissue type and (E) the proportion of mtDNA mutations in each tissue for each patient. (F) A comparison of the number of variants observed in each tissue. A significantly greater number of mutations was observed in the cardia compared with BE (P < .05). (G) Mutation burden was not associated with gland phenotype. Patients are ordered by decreasing number of mutations, and a trend was observed in mutation frequency with increasing age (Pearson’s correlation R2 = 0.72, P = .02).

