
Figure 3. Activity of inhibitor-treated GSK-3β after jump dilution.
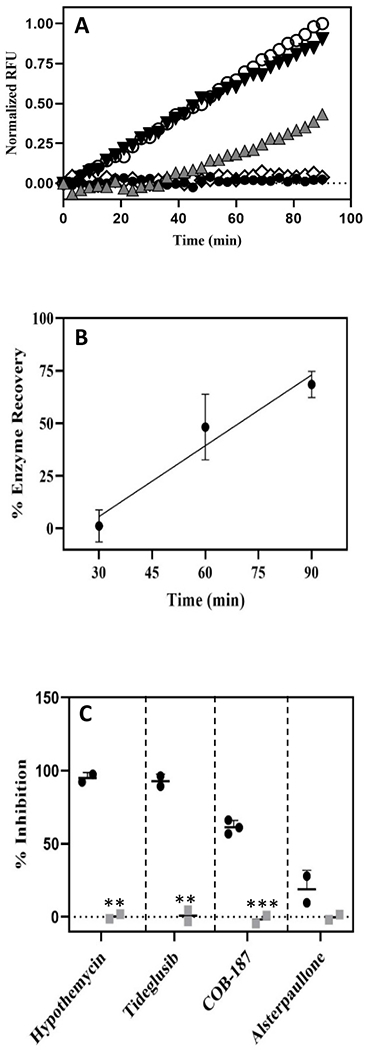
(A) Normalized RFU (y-axis) correlates with the cumulative enzyme activity while time (x-axis) is the time since the initiation of the reaction with the “jump dilution”. Each curve represents a treatment with the DMSO control or an inhibitor: open circles 1% DMSO control; black inverted triangles alsterpaullone; grey upright triangles COB-187; open diamonds tideglusib; and black circles hypothemycin. Curves from separate experiments, each normalized to its own DMSO control, have been plotted on the same axis for comparison (DMSO curve is representative from that set of experiments). Additional replicates provided in Supp. Fig. S3. (B) Recovery of GSK-3β pre-treated with COB-187 over time. The activity of GSK-3β pre-incubated with COB-187, relative to untreated GSK-3β, determined over three different time periods from the initiation of the reaction with the jump dilution, is shown. The activity of GSK-3β pre-treated with COB-187 increased with time from the jump dilution suggesting that the COB-187 was dissociating from GSK-3β. The 95% confidence interval of the slope of the regression line fit to the enzyme recovery data did not span zero indicating that the GSK-3β activity increased with time since the jump dilution. (n=3; error bar ± SD). (C) The percent inhibition of GSK-3β activity for each compound after the jump dilution experiment (black circles) and at the same condition as after the jump dilution but without preincubation of the GSK-3β with the compounds (grey squares) is shown. Error bars denote SD with n ≥2. ***p < 0.001 and **p < 0.01 as determined by t-test comparing the black and the grey symbols for each compound.