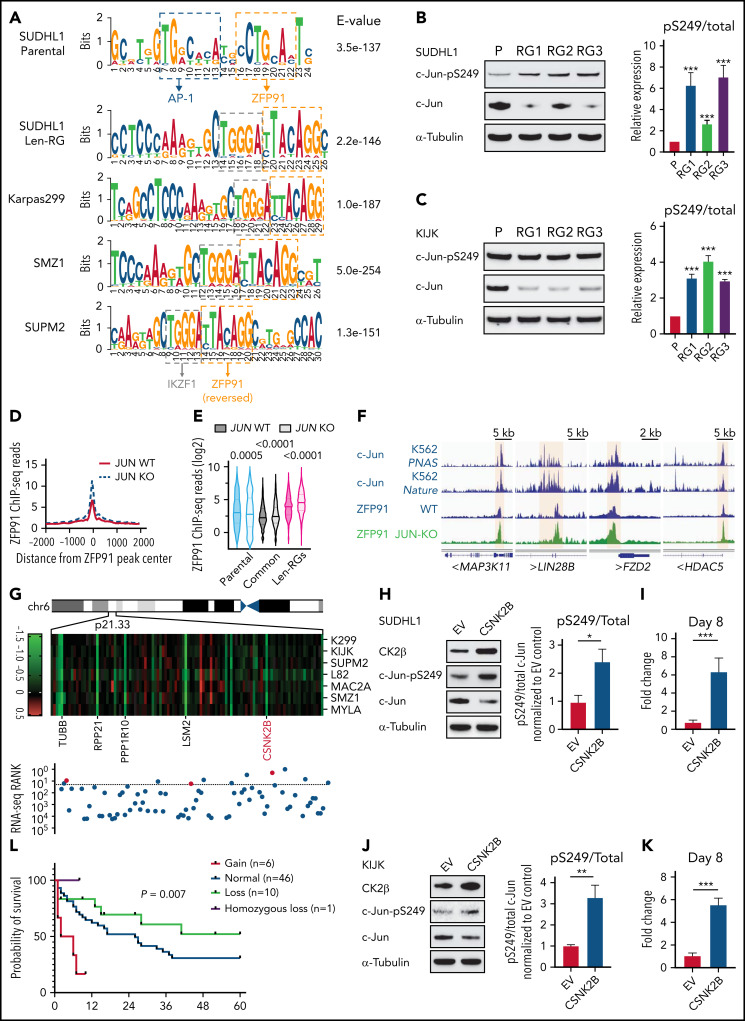
Figure 6.
Inactivation of the AP-1 transcription factor c-Jun contributes to ZFP91 rewiring. (A) DNA sequence motifs at ZFP91 ChIP-seq peaks in SU-DHL-1 parental, len-regrown cells, and 3 primary IMiD-resistant TCL lines. Motif analysis was performed using MEME-ChIP. (B) Representative western blot (left) and quantitative analysis (right) of phospho-Ser249 (pS249) and total c-Jun in SU-DHL-1 parental and len-regrown cells. (C) Representative western blot (left) and quantitative analysis (right) of phospho-Ser249 (pS249) and total c-Jun expression in KI-JK parental and len-regrown cells. (D) Metagene plot shows the distribution of ZFP91 ChIP-seq signals around ZFP91 peaks (plus or minus 2 kb) that were enriched in len-RGs (peaks indicated in Figure 5D). Data are from SU-DHL-1 cells with dox-induced JUN-knockout (KO) vs wild-type (WT) control. (E) Violin plots show ChIP-seq reads of ZFP91 signals enriched in the 3 groups of peaks defined in Figure 5D. Data are from SU-DHL-1 cells with dox-induced, JUN-KO vs WT control. (F) IGV tracks showing ZFP91 binding at the MAP3K11, LIN28B, FZD2, and HDAC5 gene loci in SU-DHL-1 JUN-KO cells (green) compared with WT control (blue). c-Jun ChIP-seq data were downloaded from ENCODE.40,41 (G) Heatmap showing CERES depletion scores for genes within the 6p21.33 amplicon based on our previous CRISPR screen across 7 TCL lines (upper) and rank for those genes among all genes upregulated in len-regrown vs parental cells (bottom). The dashed line indicates the top 20 genes upregulated by RNA-seq in len-regrown cells. (H) Representative western blot (left) and quantitative analysis (right) of pS249 and total c-Jun expression in SU-DHL-1 cells with CSNK2B overexpression compared with empty vector control. (I) Cell count in SU-DHL-1 cells with CSNK2B overexpression treated with 1 μM len or DMSO. Shown in right, comparison of the fold change of cell numbers relative to empty vector (EV) control at day 8. (J) Representative Western blot (left) and quantitative analysis (right) of pS249 and total c-Jun expression in KI-JK cells with CSNK2B overexpression compared to empty vector control. (K) Cell count in KI-JK cells with CSNK2B overexpression treated with 1 μM lenalidomide (Len) or DMSO. Results are reported as fold change of cell numbers relative to empty vector (EV) control at day 8. The experiment was performed in triplicate and replicated twice. Data are presented as mean plus or minus SD. Comparisons are by 2-tailed Student t test. (L) Kaplan-Meier survival curve of PTCL patients.32,33 Patients were divided into 4 groups according to copy number of 6p21.33. Cumulative OS time were calculated using the Kaplan-Meier method and analyzed by the log-rank test. **P < .01; ***P < .001. Dox, doxycycline; OS, overall survival.

