Figure 4.
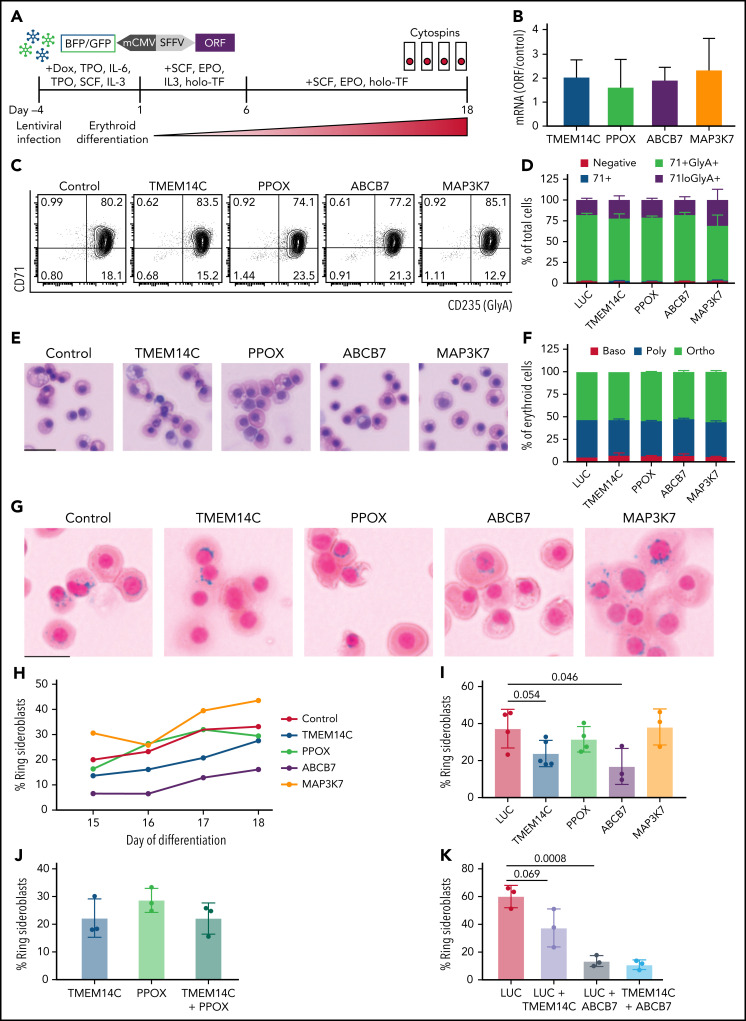
Rescue of TMEM14C and ABCB7 reduces RS formation. (A) Schematic of the functional RS rescue experiments. SF3B1-mutant 5F-HPCs were transduced with lentiviruses overexpressing individual ORFs or LUC control to 50-70% transduction efficiency. To induce differentiation, doxycycline was removed and cells were moved into erythroid differentiation media containing SCF, EPO, IL-3, and holo-TF (without exogenous iron) for 6 days prior to the removal of IL-3 from culture. Cytospins were collected between days 15 and 18 as indicated and stained for RS with Prussian blue. (B) ORF mRNA overexpression level measured by quantitative PCR and normalized to LUC control at day 15 of erythroid differentiation; mean ± SD of n = 3 independent experiments. (C) Representative CD71 and GlyA flow plots of SF3B1-mutant cells expressing each ORF or LUC control on day 18 of erythroid differentiation. CD71 and GlyA staining is indicative of the stage of erythroid differentiation. (D) Erythroid differentiation staging using CD71 and GlyA levels as measured by flow cytometry using gating strategy shown in 4C at day 18 of erythroid differentiation; mean ± SEM of n = 3. (E) Representative May-Grunwald Giemsa staining of erythroid cell morphology on day 18 of erythroid differentiation. Scale bar = 25 mm. (F) Quantification of erythroid cell morphology using May-Grunwald Giemsa staining from day 18 of erythroid differentiation; 2 independent experiments. (G) Representative cytospin images of erythroid cells expressing each ORF or LUC control stained with Prussian blue iron staining for RS quantification. Scale bar = 25 mm. (H) Quantification of RS counts in SF3B1-mutant cells expressing each ORF or LUC control over the course of days 15-18 of erythroid differentiation. Mean values are shown for each day, TMEM14C, ABCB7, LUC control n = 3 independent experiments; PPOX and MAP3K7 n = 2 independent experiments. (I) Maximum RS counts between days 15-18 of differentiation for each ORF or LUC control. Each point represents an independent experiment (n = 3 - 5 independent experiments), >500 erythroid cells counted per experiment; mean± SD. P values calculated using a t test. (J) RS counts on day 18 of erythroid differentiation for the combination of TMEM14C and PPOX, compared with TMEM14C or PPOX alone. Each point represents an independent experiment, >500 erythroid cells counted per experiment; mean± SD. (K) RS counts on day 18 of erythroid differentiation for TMEM14C and ABCB7 combination compared to LUC combinations or LUC alone in SF3B1-mutant erythroid cells. Each point represents an independent experiment (n = 3), >500 erythroid cells counted per experiment; mean ± SD. P values calculated using a t test.

