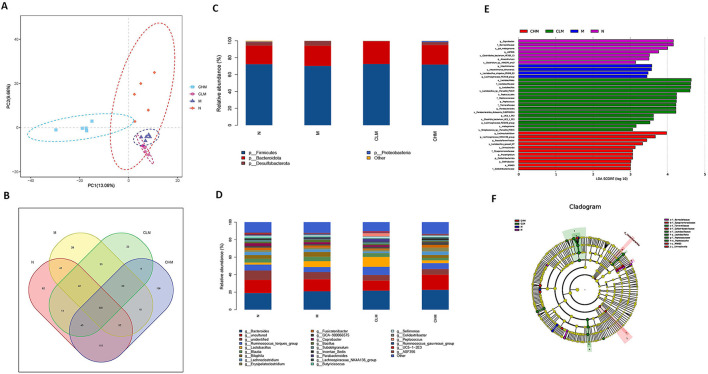
Figure 10.
Effects of CSP on intestinal microflora of immunosuppressed chickens. (A) Partial least squares discriminant analysis (PLS-DA). (B) Venn diagram. (C,D) The abscissa is the sample name, and the ordinate is the relative abundance of species in the sample. The graph shows information about species with relative abundance of more than 1%. (C) Microbe distribution at phylum level in different groups. (D) The distribution of microorganisms at the generic level in different groups. (E) Histogram of LDA ditribution based on LEfSe analysis of classification information. (F) Evolutionary branching diagram of LEfSe analysis based on classification information.

