
Figure 3.
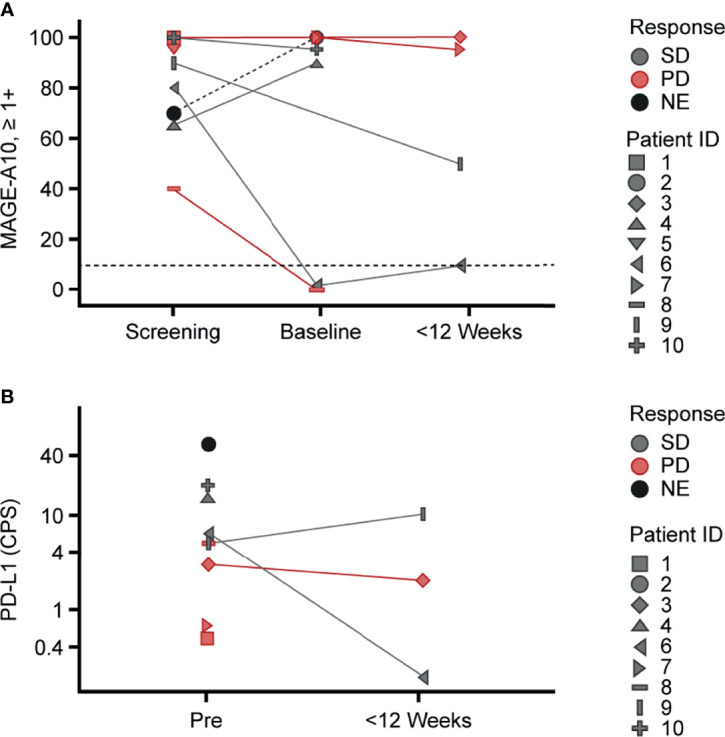
Variability of MAGE-A10 and PD-L1 expression in tumor tissue across the study patients. Pre-infusion (screening and baseline) and post-infusion biopsies collected within 12 weeks after infusion were used for (A) MAGE-A10 expression and (B) PD-L1 expression evaluation. (A) MAGE-A10 expression was assessed by MAGE-A10 immunohistochemical staining and plotted as percentage of tumor cells with 1+, 2+ and 3+ intensities. Horizontal lines designate the cut-off of 10% of tumor with ≥1+ intensity of staining. (B) PD-L1 expression was assessed using PD-L1 IHC 22C3 pharmDx assay and plotted in terms of CPS. (A, B) Data points are colored by response. Patient IDs are indicated by shape. CPS, Combined Positive Score; MAGE, melanoma-associated antigen; NE, not evaluable; PD, progressive disease; PD-L1, programmed death ligand 1; Pre, pre-infusion; SD, stable disease.