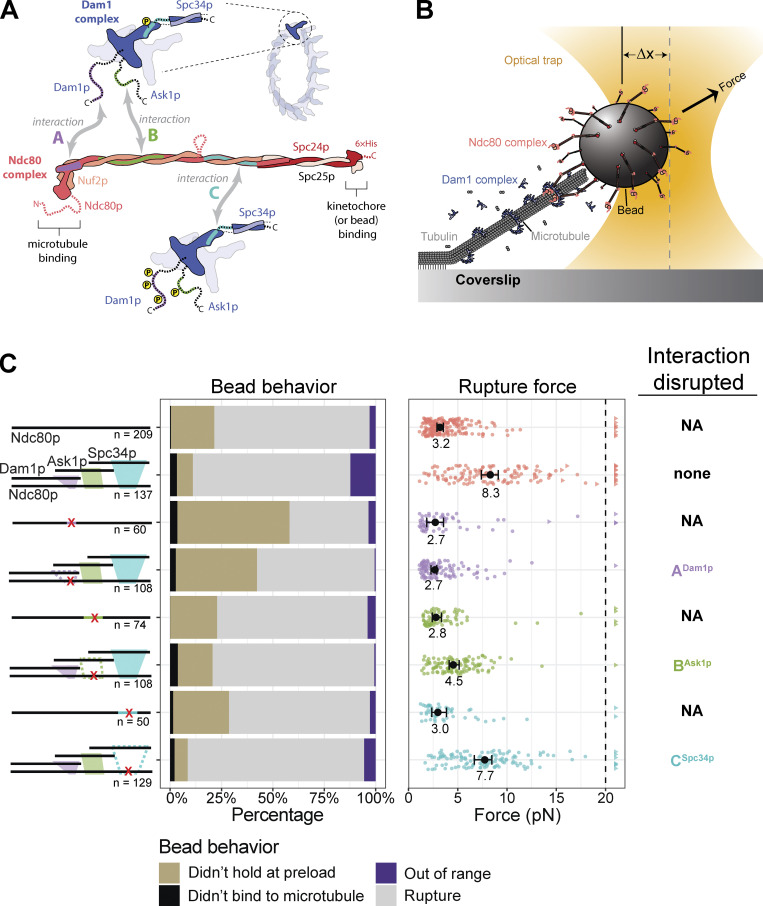
Figure 1.
Regions ANdc80p and BNdc80p support load-bearing interactions with the Dam1 complex on growing microtubule tips. (A) The Ndc80 and Dam1 complexes interact via three distinct regions on each complex. Region ANdc80p near the microtubule-binding head of Ndc80p interacts with a corresponding region ADam1p within the disordered C-terminal extension of Dam1p (highlighted in purple). Region BNdc80p interacts with BAsk1p within the C-terminal extension of Ask1p (green). Region CNdc80p interacts with CSpc34p on the C-terminal portion of Spc34p (turquoise). The Ndc80 and Dam1 complexes and their three interacting regions are shown approximately to scale, based on their high-resolution structures (Jenni and Harrison, 2018; Valverde et al., 2016). (B) Schematic of a rupture force experiment. Beads were coated either with wild-type Ndc80 complexes or with mutant Ndc80 complexes carrying insertions that disrupted regions ANdc80p, BNdc80p, or CNdc80p. Individual beads were attached using a laser trap to the tips of single growing microtubules. In the presence or absence of 30 nM Dam1 complex in solution, their attachment strength was measured by ramping the force (at 0.25 pN · s−1) until rupture occurred. (C) Rupture strengths for Ndc80-decorated beads measured in the presence or absence of Dam1 complex. Schematics on the left depict the complexes used in each experiment, including either wild-type Ndc80 complexes or mutant Ndc80 complexes with disruptions in ANdc80p, BNdc80p, or CNdc80p. The Ndc80 mutations are indicated by red X symbols, and the disrupted interactions with the Dam1 complex are shown as dashed outlines. The stacked bar graph in the middle shows the fraction of tested beads that exhibited each of the following four behaviors: (i) did not bind to microtubule (black), (ii) attached to the microtubule but did not hold the 1-pN preload force (gold), (iii) ruptured at a force >1 pN (gray), or (iv) right-censored (purple), when the bead reached the maximum trap force before rupturing. The graph on the right shows the measured rupture forces. Each colored circle represents a single rupture event. Each colored triangle represents right-censored data, when a bead reached the maximum trap force before rupturing. The total number of measurements for each condition, including ruptures and right-censored events, are indicated by n values below the schematics. The black circles represent the median rupture forces, with 95% CIs represented as black bars. Numbers below the black circles indicate median values.

