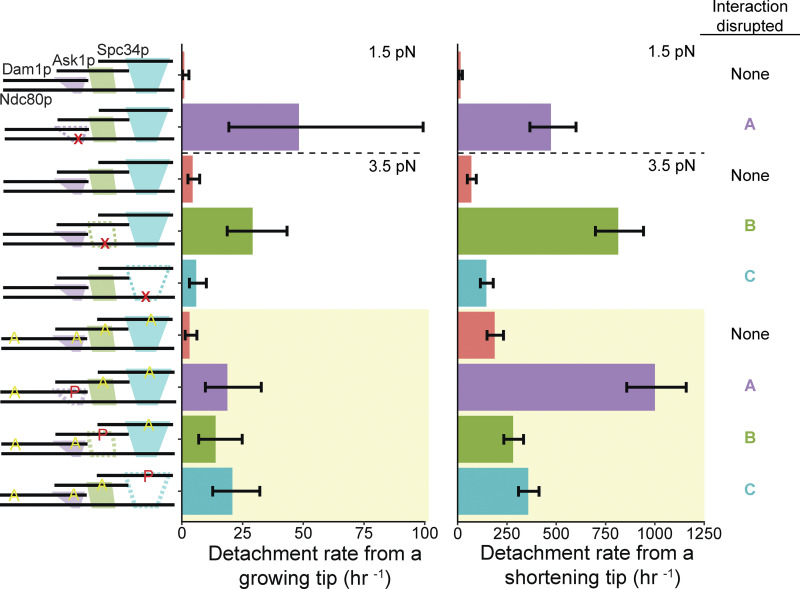
Figure 4.
All three interactions between the Ndc80 and Dam1 complexes contribute to attachment stability under constant load. Detachment rates from either growing or shortening microtubule tips, measured using beads coated with 5 nM Ndc80 complex and 5 nM Dam1 complex in solution. Schematics on the left depict the complexes used in each experiment, including either wild-type or mutant Ndc80 complexes with disruptions (indicated by red X symbols) in ANdc80p, BNdc80p, or CNdc80p and with unphosphorylated Dam1 complexes, or including wild-type Ndc80 complexes with Dam1 complexes that were either unphosphorylated or were phosphorylated at indicated sites (red P’s) and carried phospho-blocking alanine substitutions (yellow A’s), as diagrammed. Interactions that were disrupted are shown as dashed outlines in the schematics on the left and are also listed on the far right. Bars above the dashed horizontal lines on the graphs represent rates measured at 1.5 pN of constant tension. Those below the dashed horizontal lines represent rates measured at 3.5 pN of constant tension. The yellow shaded region indicates rates measured using Dam1 complexes that were phosphorylated by treatment with Ipl1p, Sli15p, and ATP. Error bars represent 95% CIs, which were estimated using the exact method.

