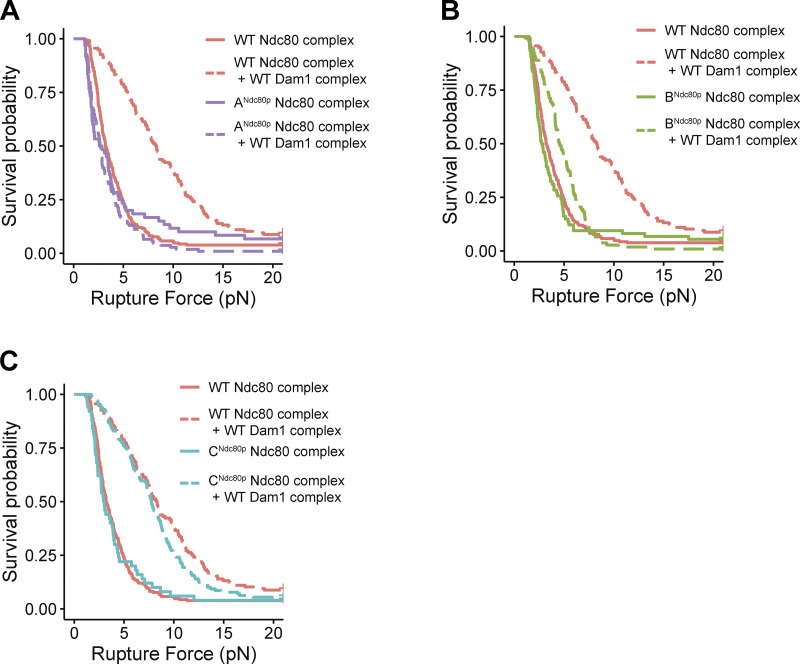
Figure S1.
Distributions of rupture force for couplers based on wild-type and mutant Ndc80 complexes, displayed as Kaplan-Meier survival curves. (A–C) Kaplan–Meier survival curves comparing wild-type Ndc80 complex versus Ndc80 mutants that disrupt region ANdc80p (A), region BNdc80p (B), and region CNdc80p (C). Solid curves were measured with Ndc80 complex–decorated beads alone, in the absence of free Dam1 complex. Dashed curves were measured in the presence of 30 nM wild-type Dam1 complex in solution. A single dataset recorded with wild-type Ndc80 complex is shown on all three graphs for comparison.

