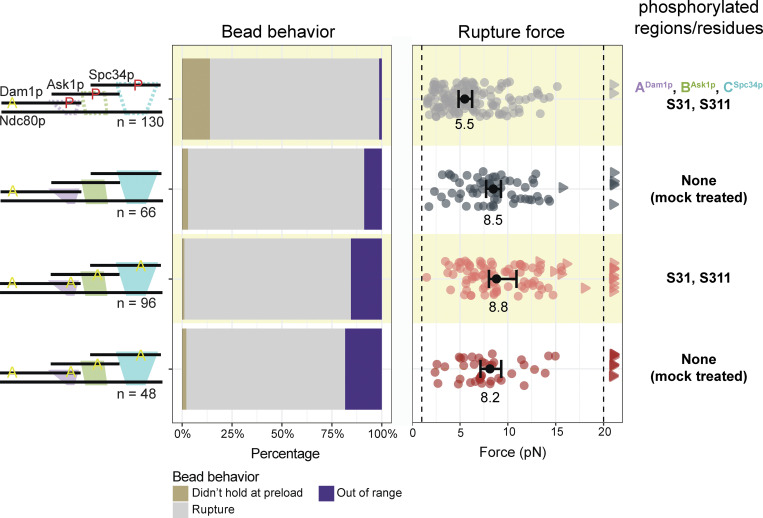
Figure S4.
Phosphorylation of two new Ipl1p target residues in Dam1p, S31 and S311, does not affect rupture strength. Rupture strengths for Ndc80-decorated beads measured in the presence of Dam1 complex phosphorylated at indicated sites (red P’s) and carrying phospho-blocking alanine substitutions (yellow A’s), as diagrammed at left. Interaction regions that were disrupted by phosphorylation are shown in the diagram as dashed outlines. The stacked bar graph in the middle shows the fraction of tested beads that exhibited each of the following three behaviors: (i) attached to the microtubule but did not hold the 1-pN preload force (gold), (ii) ruptured at a force >1 pN (gray), or (iii) right-censored, when the bead reached the maximum trap force before rupturing (purple). The graph on the right shows the measured rupture forces. Each colored circle represents a single rupture event. Each colored triangle represents right-censored data, when a bead reached the maximum trap force before rupturing. The total number of measurements for each condition, including ruptures and right-censored events, for each condition are indicated by n values below the schematics. Black circles represent median rupture forces, with bars showing 95% CIs. Numbers below the black circles indicate median values. To avoid oligomerization deficiency, S20 on Dam1p was mutated to alanine in all experiments shown here. Yellow shaded regions (rows 1 and 3) indicate experiments that used Dam1 complexes phosphorylated by treatment with Ipl1p, Sli15p, and ATP. Unshaded regions (rows 2 and 4) indicate experiments that used mock-treated Dam1 complexes (i.e., treated with Ipl1p and Sli15p, but in the absence of ATP).

