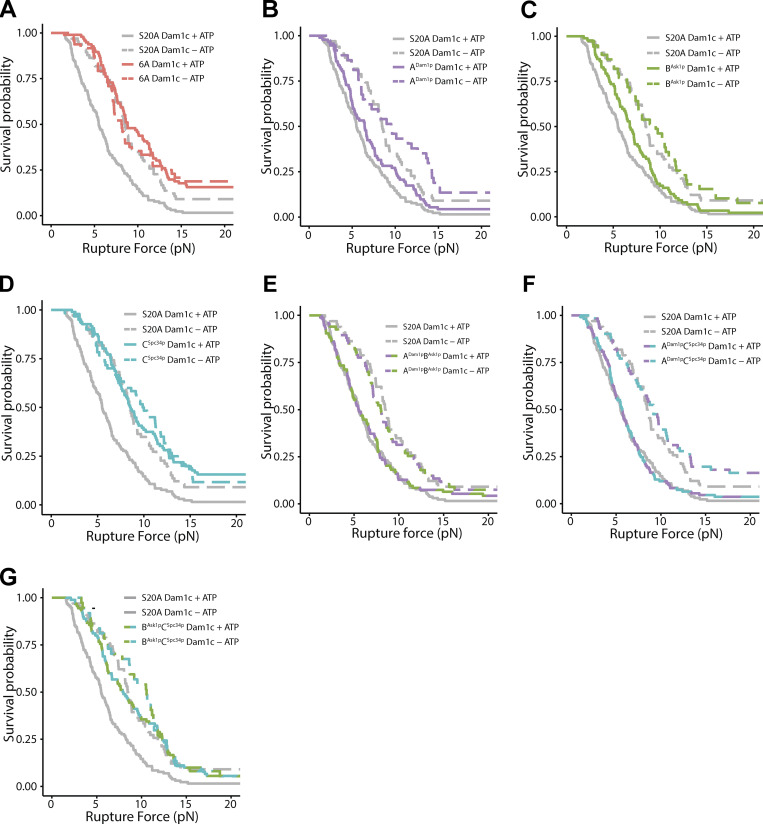
Figure S5.
Rupture force distributions for Ndc80-decorated beads measured in the presence of phosphorylated and mock-phosphorylated Dam1 complex, displayed as Kaplan-Meier survival curves. (A–G) Kaplan–Meier survival curves comparing the S20A Dam1 complex with the 6A Dam1 complex (A), the ADam1p complex (B), the BAsk1p complex (C), the CSpc34p complex (D), the ADam1pBAsk1p complex (E), the ADam1pCSpc34p complex (F), and the BAsk1pCSpc34p complex (G). Solid curves were measured with ATP-treated Dam1 complex. Dashed curves were measured with mock-treated Dam1 complex (i.e., without the addition of ATP).

