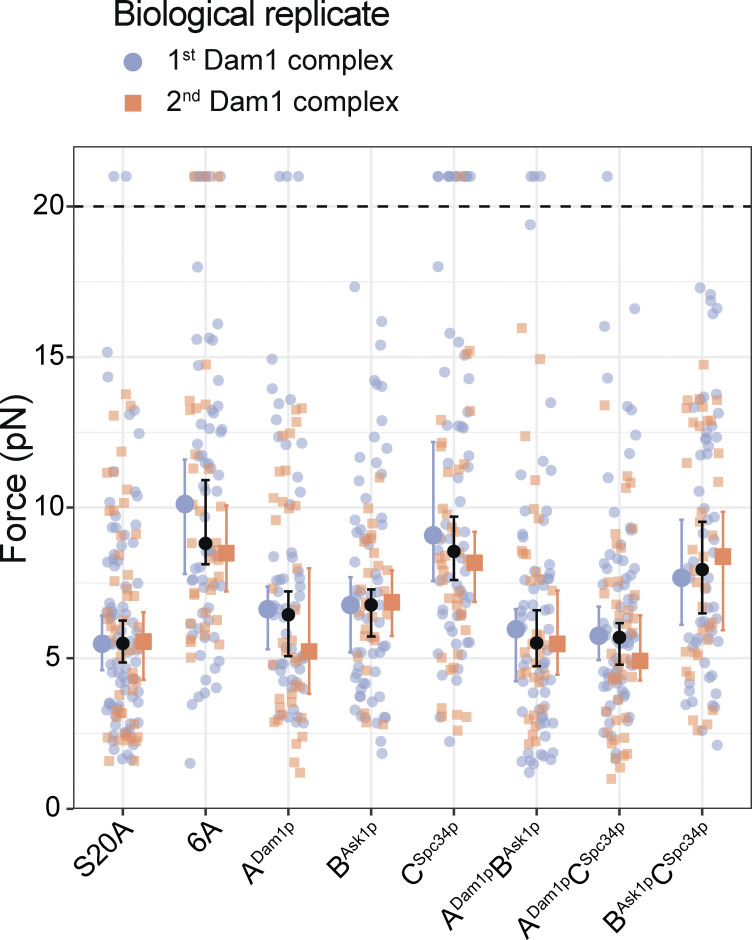
Figure S6.
Agreement of rupture force distributions across biological replicate Dam1 complexes. Superplot showing the rupture forces measured using beads coated with wild-type Ndc80 complex in the presence of the first biological replicates (blue) and the second biological replicates (orange) of the indicated Dam1 complexes, which were prephosphorylated in vitro (the same wild-type Ndc80 complex was used in all cases). Data points above the horizontal dashed line were right-censored when the bead reached the maximum trap force before rupturing. Larger colored symbols represent medians and 95% CIs for each biological replicate. Black symbols represent medians and 95% CIs for all the data combined and are identical to the medians shown in Fig. 2 B.

