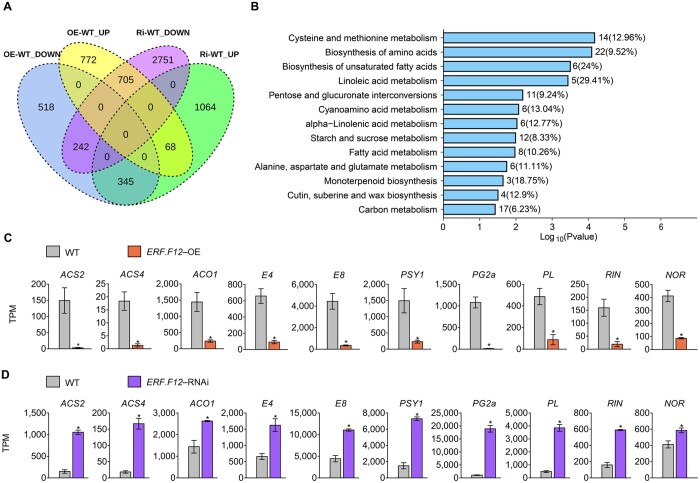
Figure 3.
RNA-seq profiling of ERF.F12-OE and ERF12-RNAi fruits. A, Venn diagram showing the overlap between downregulated and upregulated genes that were differentially expressed in ERF.F12-OE and ERF.F12-RNAi fruits compared to WT at the 41 DPA stage. B, KEGG pathway analysis of 1,050 genes with an opposite expression pattern in ERF.F12-OE and ERF.F12-RNAi fruits. C and D, Comparison of ripening-related gene expression patterns obtained by RNA-seq in ERF.F12-OE (C) and ERF.F12-RNAi fruits (D). Data are shown as means ± standard deviation (sd) from three biological replicates. Asterisks indicate statistical significance using Student’s t test, P < 0.05.

