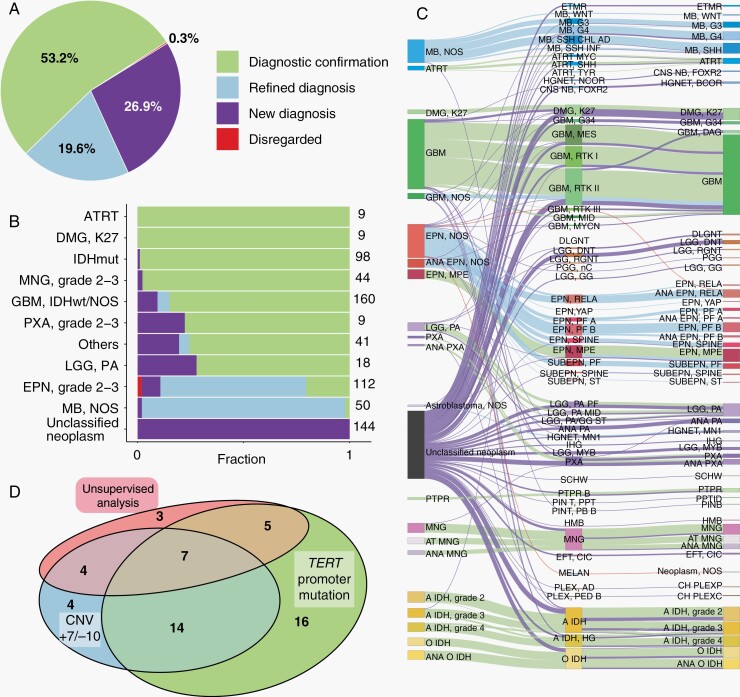
Fig. 1.
Impact of methylation classifier on CNS tumor diagnosis. (a) The impact of methylation profiling on 694 high-score referral cases is shown proportionally as: Diagnostic confirmation (light green); Refined diagnosis (light blue); New diagnosis (purple); and Disregarded (red). (b) Impact of the classifier across different histopathologically diagnosed tumor types. From top to bottom: 9 atypical teratoid/rhabdoid tumors (ATRT), 9 K27M mutated diffuse midline gliomas (DMG-K27), 98 IDH-mutant gliomas (IDHmut), 44 meningiomas (MNG), 160 glioblastomas (GBM) or GBM-NOS, 9 pleomorphic xanthoastrocytomas (PXA), 41 less common tumors (Others, other tumors with <6 samples in this cohort), 18 pilocytic astrocytomas (LGG-PA), 112 WHO grade 2-3 ependymomas (EPN, grade 2-3), 50 medulloblastoma-NOS (MB-NOS), and 144 unclassified neoplasm. (c) Sankey diagram illustrating the diagnosis of the high-score cases. From left to right are pre-classifier diagnosis, methylation classification, and final integrated diagnosis. Lines are colored by classifier impact. (d) Venn diagram showing the utilization of additional methods used for GBM diagnosis.

