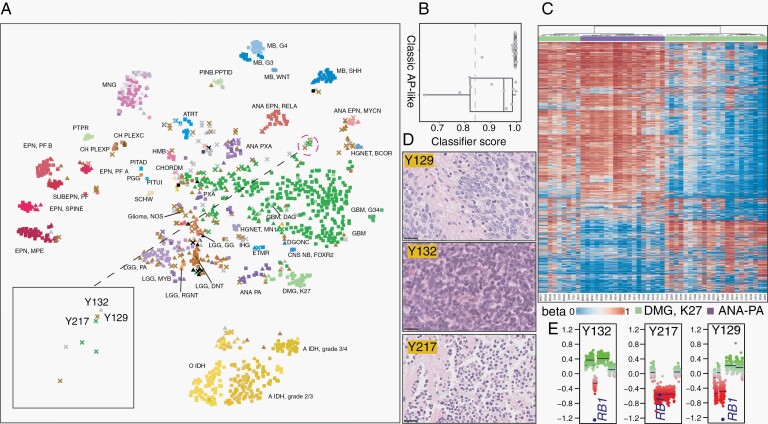
Fig. 3.
Unsupervised analysis of the methylation-profiled cohort. (a) t-SNE analysis of 1258 methylation-profiled tumor cases colored by final diagnosis and shaped by classification scores as indicated in Figure 2a. (b) The classifier scores of the cases diagnosed as DMG-K27 tumors in 2 groups: classic DMG-K27 and AP-like DMG-K27. (c) Cluster heatmap of in-house 18 ANA-PA and 31 DMG-K27 tumors indicating 2 groups of DMG-K27. Tumor types are colored on the top of heatmap, light green: DMG-K27, purple: ANA-PA. (d) H&E stains of Y132, Y217, and Y129 with 25 µm scale bars on bottom left (e) CNV plots on chromosome 13 revealing the common RB1 loss in Y132, Y217, and Y129.

